| Issue |
Mechanics & Industry
Volume 27, 2026
|
|
|---|---|---|
| Article Number | 15 | |
| Number of page(s) | 15 | |
| DOI | https://doi.org/10.1051/meca/2025035 | |
| Published online | 06 April 2026 | |
Original Article
Dynamic characteristics of floating offshore multi-turbine platforms with flexible constraints
1
College of Intelligent Manufacturing, Qingdao Huanghai University, Qingdao 266427, PR China
2
College of Mechatronic Engineering China University of Petroleum (East China), Qingdao 266580, PR China
* e-mail: This email address is being protected from spambots. You need JavaScript enabled to view it.
Received:
9
July
2025
Accepted:
1
December
2025
Abstract
Due to the complexity of analyzing the structural strength of offshore floating wind power platforms under combined wind, wave, and current loads, the research developed a flexible constraint-based method for strength analysis of floating structures. A dynamic model of the floating structure was established using finite element virtual constraint mechanics, incorporating d'Alembert's inertia release theory. The accuracy and advantages of the proposed theoretical method were validated through comparisons of numerical simulations and experimental test results. Compared to traditional quasi-static and equivalent dynamic analysis methods, the flexible constraint-based strength analysis method presented in this study yielded overall stress results that most closely matched experimental data, improving stress analysis accuracy by approximately 19%. The findings indicate that the maximum stress under combined wind, wave, and current loading reaches 138 MPa, with the most critical location being the connection between the cross brace and the buoy. These results provide theoretical support and methodological guidance for the strength and safety assessment of large, complex floating structures in marine environments.
Key words: Flexible constraints / floating bodies / theoretical models / dynamic response / model test
© J. Zhu and Q. Zhao, Published by EDP Sciences, 2026
 This is an Open Access article distributed under the terms of the Creative Commons Attribution License (https://creativecommons.org/licenses/by/4.0), which permits unrestricted use, distribution, and reproduction in any medium, provided the original work is properly cited.
1 Introduction
The ocean energy industry has been increasingly developed and utilized worldwide due to its abundant resources, stable wind power, environmental friendliness, and numerous other advantages. To gradually enhance the development capacity of deep and open seas, fully leverage the economic benefits of the offshore wind power and aquaculture industries, reduce costs, and improve the comprehensive utilization efficiency of energy space, it is essential to study the dynamic response characteristics and multi-degree-of-freedom oscillation motion laws of offshore floating wind turbines under long-term wind, wave, and current environmental loads. The offshore floating structure, subjected to the combined effects of mooring line tension and buoyancy, exists in a unique flexible constraint state [1]. Although many studies—such as the IEA Wind Task 30/OC5 and OC6 benchmarks, NREL's FAST/OpenFAST, HAWC2, and SIMO/RIFLEX—have addressed the coupled dynamic response and validation of floating offshore wind turbines, analysis of their structural strength and stress remains insufficient. Compared with traditional fixed wind turbines, the impact loads derived from dynamic responses have a more severe effect on overall structural performance. Therefore, research on the stress strength and safety of floating foundation structures under dynamic loading is critical [2–3]. In recent years, the offshore floating wind power industry has continuously advanced toward deepwater and high-power applications, increasing the emphasis on the strength and stress safety of wind turbine foundation structures. Wang et al. proposed that, beyond wind, wave, current loads, and structural form factors, the motion state and positional posture of the floating body under actual operating conditions significantly influence the overall structural stress safety [4–7]. Fons et al. noted that existing strength analyses of floating foundation structures for offshore wind turbines primarily focus on equivalent environmental loads and quasi-static analysis, with limited consideration of strength evaluation under the motion response of floating structures [8–10]. Building on traditional methods by Lemmer et al. for analyzing the structural strength of floating wind turbines [11–15], Muhammad et al. analyzed the dynamic response characteristics by defining a rigid shell element model. They assumed the floating wind turbine foundation platform as a rigid body with six degrees of freedom and established a coupled dynamic model for the elastic and rigid body motion of the floating wind turbine system tower structure [16–19]. As illustrated in Figure 1, this paper employs ANSYS AQWA hydrodynamic analysis software to perform frequency domain analysis and determine the maximum wind, wave, and current loads. Reason: The revised text corrects grammatical errors, improves sentence structure, and enhances clarity and technical accuracy. Vocabulary has been refined for precision and readability, and punctuation has been standardized. The flow of ideas is made more coherent, and technical terms are consistently presented to better suit an academic or professional audience.
In extreme wave conditions, Danny proposed conducting time-domain analysis of floating bodies to determine the maximum motion response extremes across multiple degrees of freedom [20]. Additionally, a quasi-static finite element model of a floating wind turbine was developed to assess the structural stress by applying maximum environmental loads and extreme motion response scenarios. Traditional analysis methods typically rely on fixed constraint models and do not adequately account for the flexible constraint effects present in offshore wind turbines [21–23]. Consequently, this study comprehensively addresses the dynamic response characteristics and structural strength of floating foundations for offshore wind turbines. This approach has significantly enhanced the method for calculating structural stress in floating foundations under real operating conditions. The mechanical model analysis of offshore multi-wind turbine combined floating foundations encompasses kinematics, dynamics, and structural mechanics. By establishing a six-degree-of-freedom motion response analysis model for the combined floating foundation of multiple wind turbines, the dynamic response parameters are determined, and based on these dynamic characteristics, the stress behavior of the combined foundation is further examined. The innovation of this research lies in applying the theoretical concept of inertia release to study the structural strength of floating offshore wind turbine platforms under flexible constraints and in developing a stress analysis method for floating structures subject to flexible constraints. The feasibility of this method is validated through experimental testing. This approach is primarily suited for offshore multi-turbine integrated platforms experiencing large dynamic response amplitudes due to the combined effects of wind, waves, and currents. However, for relatively stable floating conditions, the benefits of this method are less pronounced. Therefore, when implementing this method, it is essential to thoroughly consider the motion response state of the floating structure.
In extreme wave environments, Danny put forward that floating body time-domain analysis is carried out to obtain the maximum motion response extremum under multiple degrees of freedom [20]. In addition, we have established a flexible constraint calculation and analysis model for floating wind turbines, which analyzes the stress of floating structures by applying maximum environmental loads and extreme motion response states. This effectively addresses the issue of insufficient consideration of the flexible constraint effects of floating offshore wind turbines in traditional analysis methods that employ fixed constraint models [21–23]. Therefore, this study systematically considers the dynamic response characteristics and structural strength of floating foundations for offshore wind turbines. These have effectively improved the structural stress calculation method for floating foundations of offshore wind turbines under actual operating conditions. The mechanical model analysis of an offshore multi-wind turbine combined floating foundation includes kinematics, dynamics, and structural mechanics research. By establishing a six-degree-of-freedom motion response analysis model for a multi-wind turbine combined floating foundation, the dynamic response parameters of the multi-wind turbine foundation are solved, and based on the dynamic response characteristics, the stress characteristics of the multi-wind turbine combined floating foundation are further analyzed and studied. The innovation of the research is based on the theoretical framework of inertia release, conducting research on the structural strength of floating offshore wind turbine platforms under flexible constraints, and establishing a strength-stress analysis method for floating objects under flexible constraints. Verify the feasibility of this method through experimental testing. This method is mainly applied to offshore multi-turbine integrated platforms with large dynamic response amplitudes under the combined action of wind, waves, and currents. In addition, for a relatively stable floating state, the advantages of using this method are not significant. Therefore, when applying this method, the motion response state of the floating structure should be fully considered.
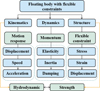 |
Fig. 1 Mechanical analysis method for floating bodies on the sea. |
2 Establish a mechanical model for floating structures
2.1 Structural simplification
The research focuses on offshore floating multi-wind power systems. Based on the complexity of the structure and load action forms of floating multi-wind turbine systems, the stress distribution law of offshore floating structures under different load forms was studied by adopting the approach of simplifying the structure first and then analyzing the overall situation. Firstly, the analysis and research will be conducted on the floating rod mechanical model, and then gradually expanded to the research of the integrated foundation mechanical models for single wind turbines and multiple wind turbines. Combining d'Alembert's inertia release theory with the stress calculation method for restrained members in materials mechanics. The stress distribution law of floating rods in a free-floating state has been derived and improved. Figure 2 shows the structure and load distribution of offshore floating wind power. Figure 2(a) is a conceptual diagram of a multi-wind turbine offshore platform system model, which improves system stability through the symmetrical arrangement of multiple wind turbines. Figure 2(b) illustrates the distribution pattern of wind, wave, and current loads sustained by the multi-wind turbine offshore platform system model.
Unlike the traditional single wind turbine foundation load form, the multi-wind turbine integrated foundation bears multiple horizontal wind forces and torques on one hand, and on the other hand, the main float below the wind turbine provides buoyancy for the foundation platform, which can effectively balance most of the wind turbine's self-weight and wind tilt moment. To simplify the calculation, the mechanical model of the free-floating rod under flexible constraints is first analyzed. When a floating free rod is subjected to a horizontal load, as shown in Figure 3, a rod with a mass of M is subjected to a horizontal load at the right end. Assuming that the materials of the rod are the same everywhere, based on the d'Alembert theorem of the mass system, the rod with a mass M is equivalent to a mass system composed of n mass presearchs, and the mass of each presearch in the mass system is the same.
According to d'Alembert's law of inertia, the acceleration of each presearch in a system satisfies:
 (1)
(1)
Based on the cross-sectional analysis method and the presearch system d'Alembert principle, unconstrained axial force analysis of members is carried out to solve the distribution law of axial force inside the members. Due to the complexity of the load-bearing points on the integrated foundation of floating multi-wind turbines, the paper further analyzes the influence of different load positions on the stress distribution of floating free members. As shown in Figure 4, the step-by-step law of internal forces is applied to loads at different positions of the structure. Figure 4(a) depicts the internal force distribution diagram when the rightmost end of the floating rod is subjected to a horizontal rightward tensile load. Figure 4(b) illustrates the internal force distribution diagram when the middle of the floating rod is subjected to a horizontal rightward tensile load. Figure 4(c) displays the internal force distribution diagram when the leftmost end of the floating rod is subjected to a horizontal rightward tensile load. Figure 4(d) shows the internal force distribution diagram when the leftmost, middle, and rightmost ends of the floating rod are simultaneously subjected to a horizontal rightward tensile load.
The above four load application methods and stress distribution laws have been studied and completed. Compared to the actual complexity of floating platforms, the derivation based on a single member is too simplified. Therefore, theoretical analysis, numerical simulation, and experimental testing methods are considered to comprehensively analyze offshore floating platforms. Due to the complex structure of multi-wind turbine floating platforms, the theoretical model is first analyzed by simplifying the model with a single member, and the accuracy of the theoretical model is verified by combining the results of numerical simulation methods. Furthermore, a theoretical model analysis method for the floating platform structure of multiple wind turbines is established. Therefore, the complexity of the structure cannot be directly obtained through theoretical analysis methods. Therefore, the same numerical model method as the simplified model of a single member is used for analysis, and the experimental test results are compared and verified to establish the accuracy and feasibility of the strength analysis method for floating structures based on flexible constraints established in the research.
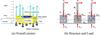 |
Fig. 2 Offshore multi-wind power system. |
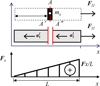 |
Fig. 3 Floating free rod equivalent mass system. |
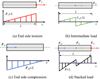 |
Fig. 4 Axial force distribution at different load positions. |
3 Numerical simulation analysis
3.1 Numerical simulation of floating free members
To further explore the stress distribution law of the multi-wind turbines' hexagonal foundation structure studied in the research, a simplified mechanical model of the hexagonal foundation members is established, as shown in Figure 13. The finite element simulation process of stress intensity of offshore multi-wind turbine floating platform structure based on flexible constraints includes two parts: hydrodynamic and structural stress. First, conduct dynamic response analysis of floating structures, including frequency domain analysis and time-domain analysis, to solve their characteristic parameters and load extremum. Then, a finite element strength analysis model is established, and combined with the inertia release analysis method, the strength stress of multi-fan floating foundation under long-term response is studied. The simulation parameter conditions refer to the sea state parameters of the Yellow Sea in China, and the parameters for the rated operating conditions are determined as wind speed of 11.4 m/s and flow velocity of 0.39 m/s, wave height of 5.49 m, and period of 11.3 s.
The material selection for the integrated foundation structure of multiple wind turbines is high-strength steel. Its Poisson's ratio is 0.3. The yield stress is 355 MPa. The Young's modulus is 2.10 × 10⁵ MPa. The floating foundation adopts a solid element model as a whole, and the wind turbine is equivalent to a mass block applied to the top of the tower. The finite element simulation maintains the quality of the simplified model of the wind turbine, and the finite element model and mesh independence verification of the foundation structure are shown in Figure 5(a) and (b).
Models with different grid cell sizes and quantities were established to verify the grid independence of the models. As shown in Figure 5(a). The number of grids in Models 1–6 gradually increases, with cell boundary sizes ranging from 60 to 30 mm and decreasing by 5 mm intervals. As the number of grids increases, the impact of grid number on Mises stress becomes smaller and smaller. The standard for determining grid independence is that the calculation error caused by changes in the number of grids is less than 3%. The error between Model 5 and Model 6 meets the requirement of grid independence, so the number of grids with a cell boundary size of 35 mm in Model 5 is 893682 as the standard for subsequent model grid division.
The boundary constraint of the multi-wind turbine combined hexagonal foundation platform adopts the inertia release method of single-point virtual constraint. The dynamic release effect of the finite element model is achieved by eliminating all degrees of freedom of the nodes from the model equation system. The theoretical calculation should fully consider the motion state of the floating foundation. Due to the fact that the finite element model in this study is a large-span platform structure with a large moment of inertia, the introduction of centrifugal force and Coriolis force during rotation is considered on the basis of traditional dynamic analysis equations. This is calculated by solving equations 5 and 6 that were established. First, the control equation for the rotational load of the floating body satisfies:
 (2)
(2)
In the formula, J is the moment of inertia,
 is the damping torque,
 is the restoring torque, and
 is the environmental load torque. The centrifugal force and Coriolis force generated during rotation must be considered based on the large overall span size of the floating platform. Therefore, when studying the strength of floating structures, centrifugal force
 and Coriolis force
 are introduced:
 (3)
(3)
 (4)
(4)
Substituting formulas (3) and (4) into formula (2) yields:
 (5)
(5)
 (6)
(6)
In the formula, l is the radius of rotation. Formulas (5) and (6) fully consider the loading law under the motion state of floating structures. The finite element model equation under flexible constraints can be equivalent to a quasi-static inertial release constraint state, and the stress solution satisfies:
 (7)
(7)
In the formula, A is the cross-sectional area, F is the external load, and σ is the axial stress. The von Mises stress calculation is as follows:
 (8)
(8)
In the formula, σ is the principal stress and τ is the tangential stress in all. As shown in Figure 5, the mechanical model of a hexagonal foundation structure under multiple wind loads is presented. To simplify the analysis, the wind turbines at the six endpoints are simplified into load forms and directly applied to the corresponding positions of the foundation. The wind load is equivalent to the horizontal load on the hexagonal foundation, and the distribution represents the arrangement number of the wind turbines. The pressure generated by the self-weight of the wind turbines is the downward load in the vertical direction. Considering the buoyancy changes caused by the shaking of the wind turbine foundation, the vertical upward load is set to show a regular trend in the front, middle, and rear rows, and the torque is applied equivalently at the contact position between the wind turbine tower and the hexagonal foundation.
Based on the analysis results of the gas–liquid dynamic response of a multi-wind turbine combined floating foundation, while considering the time-domain ultimate motion response and load response state, the maximum displacement, maximum pitch angle, and speed were added as boundary conditions to the finite element model for stress solution. The results are shown in Figure 6. Figure 6(a) presents the stress distribution contour plot of the multi-wind turbine combined platform under the combined action of wind, waves, and currents. Figure 6(b) illustrates the strain distribution contour plot of the multi-wind turbine combined platform under the same conditions. The maximum stress of the floating foundation is 192.45 MPa, located at the connection between the central cross brace and the central column of the multi-wind turbine combination floating foundation, with a maximum deflection of 0.00823 m. The deflection occurs on the rightmost wind turbine float, mainly due to the consideration of the inertia release condition of the model. The upper and middle parts of the overall structure are subjected to horizontal rightward wind and wave loads, and the bottom is subjected to horizontal leftward mooring tension loads. The model material is Q355 steel, and the solution result is less than the allowable stress of 355 MPa, which meets the safety requirements. According to the stress distribution cloud map, the large stress area of the multi-wind turbine combination floating foundation is mainly distributed in the transverse support structure, and the stress distribution between each transverse support is uneven. Therefore, in Figure 7, in-depth research and analysis are carried out on the strength analysis method of the floating structure and the stress distribution characteristics of the multi-wind-turbine combination floating foundation. Figure 7 (a) shows the stress distribution of a multi wind turbine combination platform under horizontal load. Figure 7 (b) shows the stress distribution of a multi wind turbine combination platform under vertical load. Figure 7 (c) shows the stress distribution of a multi wind turbine combination platform under vertical upward load. Figure 7 (d) shows the stress distribution of a multi wind turbine combination platform under wind load.
Figure 7 shows the influence of horizontal force, vertical force, and torque load on the stress of the wind turbine foundation model. The gray curve represents the theoretical equation calculation results, the yellow curve represents the rectangular foundation analysis results, and the blue curve represents the multi-wind turbine integrated hexagonal foundation structure model analysis results. Due to the mutual constraint of multiple wind turbines, the stress generated based on the torque load has also weakened, with a stress magnitude of about 2/3 of the theoretical result. However, there are significant stress steps and sudden changes at the front, middle, and rear wind turbine points, with the stress sudden change value at the middle wind turbine position being higher than the theoretical calculation result. This is because the middle wind turbine serves as the rotational center point of the overall torque comprehensive effect, resulting in a torque superposition effect.
Based on the complexity of the load in the hexagonal foundation model of multiple wind turbines, further consider the distribution law of von Mises stress. As shown in Figure 8, the relationship between von Mises stress and the maximum normal stress on the x-axis is shown, and the absolute value of the maximum normal stress is basically consistent with the von Mises stress. The maximum stress point occurs at L/4 and 7L/12, with the middle position as the reference point. The Mises stress is asymmetrically distributed from the middle to both sides, and the maximum stress on the right side is higher than that on the left side. This is due to the consideration of the uneven vertical load caused by the shaking response of the wind turbine foundation system. Therefore, the research establishes an analysis method that is more conducive to solving the real stress distribution law in actual environments and providing guidance.
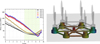 |
Fig. 5 Simplified model of integrated foundation for multiple wind turbines. |
 |
Fig. 6 Stress and deflection of model. |
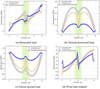 |
Fig. 7 Stress distribution under external force application. |
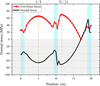 |
Fig. 8 Comparison of stress results. |
4 Small-scale model test
In order to explore the more realistic motion response law of the Deepwater Multi-Floater (DMF) design scheme, model flume test research was carried out. Due to the large size and span of the overall structure of DMF, it is still very difficult to realize the full truth test model at this stage. Therefore, based on the principle of similarity ratio, the research carries out the equivalent design of DMF in the ratio of 1:200 to simplify the difficulty of test realization. This test was conducted in the wind, wave, and current flume laboratory of China University of Petroleum (East China). Through push plate equipment and blast force generator equipment, the simulated sea conditions with different wind, wave, and current heights; different periods; different currents; and different wind speeds can be manufactured. The motion characteristics of the integrated device under different wind, wave, and current conditions are obtained through the model test. The six degrees of freedom motion response data of DMF are measured by the tension-sensing system and tilt sensor, and the hydrodynamic performance of the actual scale model is evaluated by the small-model test method. Figure 9 shows the overall test equipment for the physical prototype of a multi-wind-turbine-combined floating platform.
In the physical model test of wind, waves, and currents, the testing equipment includes wind testing equipment, wave and current parameter testing equipment, power system detection equipment, and stress–strain system detection equipment. The wind testing device includes an anemometer and a wind parameter display device, as shown in Figure 10.
The TXHPFSY60 model is selected as an anemometer for wind direction and speed measurement. The wind speed is set to 0–25 m/s, and the measured wind direction is 0°. Six-channel data collection and storage methods are used to save the instantaneous, maximum, minimum, average, and standard deviation values of wind speed and direction. The power system detection device includes tension sensors, floating structure inclinometers, and digital cameras, mainly used to detect the mooring tension and six-degree-of-freedom motion response amplitude of floating platforms. Please refer to Figure 11 for details.
The testing device for the strength distribution characteristics of multi-wind turbine combined floating platform structures mainly uses the strain gauge testing method for analysis. As shown in Figure 12, the stress variation characteristics of the key structure were measured by symmetrically arranging six transverse braces on the floating foundation structure.
The strain gauges are sealed. The layout position is set at MWF six floats and upper and lower crossbars. The arrangement method adopts axial and axial equidistant arrangements and circumferential equidistant arrangements. The spacing distance is 0.5 times the diameter of the cross brace. Table 1 is a statistical table of experimental instruments.
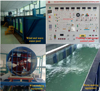 |
Fig. 9 Overall test platform. |
 |
Fig. 10 Wind testing system. |
 |
Fig. 11 Power system inspection. |
 |
Fig. 12 Stress–strain system detection. |
Data collection devices.
4.1 Model similarity ratio and parameter determination
In order to ensure that the test data can reflect the real situation, the physical properties of the model and the real object should be as similar as possible. The scale shall be carried out according to the scale ratio, and the test model shall be processed and manufactured at the ratio of 1:200. The proportional relationship between the physical parameters of the model and the actual components is shown in Table 2. Where subscript “s” is the actual parameter and subscript “m” is the model parameter.
Proportional relationship of physical parameters.
4.2 DMF test prototype
The processing of the DMF small-scale model prototype is based on the similarity ratio data of physical parameters, and the structural safety strength is fully considered on the premise of ensuring the tightness of the model structure. Based on the theoretical analysis of multiple wind turbine loads, determine the load distribution pattern of each wind turbine.
Based on the equivalent analysis method, an equivalent physical model of the wind load effect is established, as shown in Figure 13.
The multi-wind turbine combination floating foundation adopts a six-point mooring method:
 (9)
(9)
In the equation,
 represents longitudinal displacement,
 represents the full-length mooring restoring force,
 represents the cutting mooring restoring force, and
 represents the number of displacements. The mooring system is designed using the truncation method, as shown in Figure 14.
The mooring system adopts a six-point symmetrical arrangement, and the model test research based on similarity criteria is carried out in the towing pool of the aerodynamic and hydrodynamic laboratory. The wind turbine wind test device includes an anemometer and a wind parameter display device, as shown in Figure 15. Figure 15 (a) shows the variation of aerodynamic loads on various wind turbines under wind speeds of 0-30m/s. Figure 15 (b) shows the variation of total aerodynamic load on a multi wind turbine combination platform under wind speeds of 0-30m/s.
Figure 15 shows the numerical simulation and experimental test results of wind speed under rated operating conditions of a multi-wind turbine combination system. When the wind speed is between 10 and 20 m/s, the front-row wind turbines are subjected to larger aerodynamic loads, while the rear-row wind turbines have smaller aerodynamic load values. When the wind speed is between 20 and 25 m/s, the comprehensive aerodynamic load value of multiple wind turbines is relatively large, which has the greatest impact on the overall structural safety. It can be seen from the figure that the aerodynamic load test results of the multi-wind turbine are basically the same as the theoretical analysis results, with a maximum error of less than 10%, which meets the accuracy requirements of the model. The experimental test results are slightly larger than the simulation results, mainly because the thrust analysis in the experiment includes the shear force at the top of the tower. The aerodynamic thrust of the multi-wind turbine combination system meets the requirement that the front wind turbines WT11, WT21, and WT22 are greater than the rear wind turbines WT31, WT32, and WT41, which is consistent with the wake effect factors of the multi-wind turbines. The overall trend of its variation is close to the theoretical calculation results. Therefore, in the wind wave flow load test, the equivalent analysis method can be used to introduce the aerodynamic load of the wind turbine for research.
Based on the rated power operating wind speed of the wind turbine of 11.4–25 m/s, the wind speed of the test under the similarity ratio is 0.2–2.5 m/s, and the wind speed interval is 0.1 m/s. The test results obtained are converted into the prototype structure. The aerodynamic load test results of multiple wind turbines are basically the same as the numerical simulation results, with a maximum error of less than 10%. In response to the complexity of wind, waves, and current loads at sea and the periodicity of the motion response of floating foundations, multi-channel strains were measured as shown in Figure 16. Including the distribution of circumferential stress and axial stress. Due to the periodic loads of wind, wave, and currents, as well as the harmonic motion response of the floating foundation, the transverse brace stress also exhibits periodic fluctuations in the time domain. The maximum stress occurs at the connection between the cross brace and the float. The maximum stress amplitude is about 174 MPa, occurring within 0–200 s from the beginning of the simulation. After 200 s, the overall fluctuation pattern is relatively stable, and the axial stress distribution of the transverse brace is characterized by larger end values and smaller middle stress values.
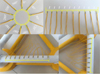 |
Fig. 13 Aerodynamic load test model for multiple wind turbines. |
 |
Fig. 14 Physical model of mooring system. |
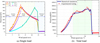 |
Fig. 15 Wind load. |
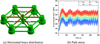 |
Fig. 16 Axial stress. |
4.3 Test conditions and measuring equipment
Due to the ultimate application of multi-wind turbine combination floating foundation in actual sea wind power generation, in order to further test the adaptability and reliability of the equipment under actual wind, wave, and current sea environmental loads, the paper further conducted MWF physical model gas–liquid dynamic response testing in the Yellow Sea area of China. The test location was at longitude 120.1450979°, latitude 35.9059951°, sea depth of 30 m, test wind level of 2, wind speed of 1.80 m/s, equivalent MWF prototype equipment operating wind speed of 22.05 m/s, irregular waveform, maximum wave height of 0.08 m, minimum wave height of 0.03 m, wave period between 0.51 and 0.96 s, unsteady current, maximum flow velocity of 0.31 m/s, and test time of 600 s. The experimental testing site and results are shown in Figure 17.
The six degrees of freedom dynamic response results of the multi-wind turbine combination floating foundation were obtained in the actual offshore wind, wave, and current testing environment, as shown in Figure 17. The multi-wind turbine combination floating foundation has larger response amplitudes in the three main degrees of freedom: longitudinal oscillation, pitch, and heave. The longitudinal oscillation response amplitude is ± 0.2 m, the heave response amplitude is −0.1∼0.3 m, and the pitch response amplitude is ± 4.5°.
The other three degrees of freedom response amplitudes are smaller, which is consistent with the numerical simulation and experimental pool test results. The maximum stress occurs at the connection between the cross brace and the float. When the operating time is greater than 200 s, the response amplitudes are smaller. The motion response of the multi-wind turbine combination floating foundation in the rear system shows a stable periodic law, with motion response fluctuations in the sway, roll, and yaw directions. This may be due to the complexity of wind, wave, and load changes in actual sea areas, and the specific reasons need further research. However, due to its small motion amplitude, which is about 10% of the three main degrees of freedom motion amplitude, it does not affect the overall dynamic response and strength analysis of MWF floating structures.
Figure 18 shows the stress distribution of the B1 cross brace path for a multi-wind turbine combined floating foundation under the combined action of wind, waves, and currents, considering traditional quasi-static analysis method, frequency domain analysis method, and dynamic response analysis method in the paper. Figure 18 (a) shows the upper crossbeam path B1 on the windward side of the left end of the multi wind turbine combination platform model. Figure 18 (b) shows the maximum stress steps of the crossbeam path B1 simulated by three methods. Figure 18 (c) shows the error steps simulated by the flexible constraint analysis method. Figure 18 (d) shows the error deviation rate under the simulation of flexible constraint analysis method. Figure 18a shows the selected path range from point A to point B, and Figure 14b shows the results of the three analysis methods and experimental tests. According to the stress curve distribution, the B1 cross brace stress shows a trend of decreasing first and then increasing from point A to point B. The quasi-static analysis method shows that the overall stress value is relatively small, with a maximum stress of 106.32 MPa, and the inflection point of the extremely small stress value is close to the center of the path. Based on the dynamic response analysis method and frequency domain analysis method, the stress distribution trend is relatively consistent, and the minimum inflection point is close to the right end of the transverse brace. The stress value obtained based on the dynamic response analysis method is closer to the experimental test results, and the calculation accuracy is improved by 19% compared with the traditional analysis method, which verifies the accuracy of using the analysis method. Figures 18c and 18d show the the root mean square error and average deviation tables of three methods for the maximum lateral support B1 of a multi-wind turbine combination platform. Select the stress values of 10 points as the maximum stress value within the 500 s time-domain response analysis range, which facilitates the accuracy of result comparison. The variation of time-domain response stress amplitude is shown in Figure 16b. The comprehensive analysis of the root mean square error and average deviation table shows that the flexible analysis method proposed in this paper has improved the prediction accuracy by about 19%. The stress value obtained based on the dynamic response analysis method is slightly higher than that of the frequency domain analysis method, and it presents a curved distribution form as a whole in the stress drop section, which is more in line with the stress distribution equation of floating structures in Actual wind, wave and current operation conditions. To clarify the stress distribution law of floating structures based on dynamic response, the paper further explores the stress distribution characteristics of key structures of multi wind turbine combined floating foundations.
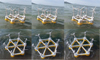 |
Fig. 17 Actual sea MWF response test. |
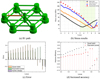 |
Fig. 18 B1 cross brace stress. |
5 Conclusion
With the growing demand for energy, there is a need for offshore wind turbine floating platform systems with larger specifications and sizes to enhance power generation efficiency and lower levelized energy costs. The research establishes a strength calculation model for floating structures under flexible constraints, offering a theoretical foundation for designing and developing offshore floating equipment. Upgrading floating platforms for offshore wind turbines poses engineering challenges, especially in designing support structures like towers. Developing such models requires extensive, reliable simulation and experimental data, particularly for multiphysics interactions that are difficult to capture through on-site measurements alone. The simulation and scale testing methods proposed in this study provide valuable data that can support future frameworks based on artificial intelligence and digital twins. Moreover, the dynamic characteristic analysis method for floating platforms developed in this research is applicable not only to offshore wind power equipment design and development but also offers strong theoretical backing for structural health monitoring, predictive maintenance, and energy modeling.
Building on existing research methods that couple dynamic response and verification of floating offshore wind turbines, this study further develops a theoretical analysis approach for the structural strength of floating offshore wind turbines considering flexible constraints and demonstrates its advantages over traditional stress analysis methods through comparison and validation.
Compared to conventional quasi-static and equivalent dynamic analysis methods, the strength analysis method for floating structures with flexible constraints developed here shows a maximum stress of 138 MPa under combined wind, wave, and current conditions, with the most critical stress location at the connection between the cross brace and the buoy. The overall stress analysis results align most closely with experimental test data, improving stress analysis accuracy by approximately 19%. This provides theoretical support and methodological guidance for strength and safety assessments of large, complex floating ocean structures.
To enhance the six degrees of freedom overall stability and operational safety of point-array wind turbine systems, the study further optimizes the mooring system design. By comprehensively adjusting factors such as mooring arrangement angle, direction, and length relationships—while maintaining pitch and sway stability of the DMF—the sway response amplitude is reduced by 47%, significantly improving system stability and adaptability to marine environments.
The paper introduces an inertia release analysis method for floating bodies with flexible constraints, mainly intended for offshore floating structures. This method is particularly effective in situations where the floating body experiences large motion amplitudes across six degrees of freedom due to wind, waves, currents, and the effects of flexible components. However, for stable or relatively stationary floating structures at sea, this method does not offer advantages over traditional approaches and may even increase computational demands. Thus, its applicability is limited in such cases.
The flexible constraint analysis method presented primarily combines floating body dynamics with structural stress analysis. Future work could involve coupling dynamic simulation outputs from software like OpenFAST or HAWC2 with finite element models of solid structures via plugin development. This integration would allow for more detailed assessments of stress distribution and time-domain variations throughout the entire structure. Such advancements would provide valuable insights and support for comprehensive studies on the operational stability and structural safety of floating wind power systems under prolonged offshore conditions and extreme wind and wave events.
There remain numerous challenges regarding the feasibility of wind power fishery systems, necessitating further research to establish a reliable concept for practical implementation. Key areas for future investigation include optimizing power generation efficiency, designing the layout of six wind turbines, and thoroughly analyzing the effects of long-term fatigue. These factors should be addressed in upcoming studies.
Nomenclature
 = Lateral acceleration caused by inertial release (m/s2)
mL = Free floating rod mass (kg)
VS = Horizontal movement speed (m/s)
VW = Actual wind speed (m/s)
Cdn = Resistance coefficient of normal flow
Cdt = Tangential flow resistance coefficient
CM = Mass factor
Cd90 = Vertical angle of attack resistance coefficient
Cd0 = Horizontal angle of attack drag coefficient
CDC = Flow resistance coefficient
Sij = Area of waterline surface (m2)
RDi = Horizontal distance (m).
Funding
The support for the research is gratefully acknowledged to the Doctoral Professor Research Project of Qingdao Huanghai University—Research on dynamic characteristics of offshore floating multi-wind power combination platform based on flexible constraints (2025boshi01). China University of Petroleum (East China) marine engineering experiment center and Qingdao West Coast science and technology innovation project “Research on key technologies of marine fishery electricity integrated development system (2019-8)”.
Conflicts of interest
The authors declare that they have no known competing financial interests or personal relationships that could have appeared to influence the work reported in the paper.
Data availability statement
Data sharing is not applicable to the research as no new data were created or analyzed in the research.
Author contribution statement
Jiangfeng Zhu: Conceptualization, Methodology, Software, Writing—original draft. Qian Zhao: Validation, Writing—review & editing.
References
- W. Lu, R. Amy, J. Jason, Y. Yu, OC6 phase I: improvements to the OpenFAST predictions of nonlinear, low-frequency responses of a floating offshore wind turbine platform, J. Renew. Energy 187, 282 (2022) [Google Scholar]
- T. Li, J. Yang, A. Ioannou, Wind forecasting-based model predictive control of generator, pitch, and yaw for output stabilisation-A 15-megawatt offshore, J. Energy Convers. Manag. 302, 118155 (2024) [Google Scholar]
- L. Yang, C. Xu, Q. He, B. Li, Q. Chen, Z. Tan, Y. Guo, Equivalent design wave selection on the extreme stress of OC5-DeepCwind semi-submersible hull for floating offshore wind turbine, J. Eng. Struct. PB346, 121703 (2026) [Google Scholar]
- B. Wang, X. Gao, Y. Li, L. Liu, H. Li, Dynamic response analysis of a semi-submersible floating wind turbine based on different coupling methods, J. Ocean Eng. 297, 116948 (2024) [Google Scholar]
- Q. Cai, D. Chen, N. Yang, W. Li, A novel semi-spar floating wind turbine platform applied for intermediate water depth, J. Sustainability 4, 16 (2024) [Google Scholar]
- C. Burak, L. Huang, Recent advances in mechanical analysis and design of dynamic power cables for floating offshore wind turbines, J. Ocean Eng. 311, 2938 (2024) [Google Scholar]
- Z. Jiang, L.Yang, Z. Gao, T. Moan, Integrated dynamic analysis of a spar floating wind turbine with a hydraulic drivetrain, J. Renew. Energy P1, 201 (2022) [Google Scholar]
- H. Fons, D. Rogier, S. Feike, Concept design verification of a semi-submersible floating wind turbine using coupled simulations, J. Energy Procedia 53, 212 (2014) [Google Scholar]
- Y. Zhang, B. Kim, A fully coupled computational fluid dynamics method for analysis of semi-submersible floating offshore wind turbines under wind-wave excitation conditions based on OC5 data, J. Appl. Sci. 11, 2314 (2018) [Google Scholar]
- Y. Yang, C. Chen, W. Zhao, T. Fan, An innovative method of assessing yield strength of floater hull for semi-submersible floating wind turbine in whole life period, J. Ocean Eng. 270, 11 (2023) [Google Scholar]
- F. Lemmer, W. Yu, B. Luhmann, D. Schlipf, P. Cheng, Multibody modeling for concept-level floating offshore wind turbine design, J. Multibody Syst. Dyn. 134, 49 (2020) [Google Scholar]
- E. Badr, E. Nacer, E. Kadri, Planning for offshore wind: an integrated smart approach combining NREL classification and TOPSIS, J. Results Eng. 2530, 27 (2025) [Google Scholar]
- V. Baltikas, N. Yannis, N. Krestenitis, A spectral wave model for inhomogeneous water wave fields using the quasi-coherent theory, J. Mar. Sci. Eng. 11, 11 (2023) [Google Scholar]
- P. Chen, C. Jia, N. Chong, Z. Hu, Application of SADA method on full-scale measurement data for dynamic responses prediction of Hywind floating wind turbines, J. Ocean Eng. 109, 2 (2021) [Google Scholar]
- S. Souza, E. Bachynski, Changes in surge and pitch decay periods of floating wind turbines for varying wind speed, J. Ocean Eng. 223, 18 (2019) [Google Scholar]
- X. Shuangyi, J. Xin, H. Jiao, Structural vibration control for the offshore floating wind turbine including drivetrain dynamics analysis, J. Renew. Sustain. Energy 11, 02 (2019) [Google Scholar]
- Q. Yuan, S. Wang, B. Wang, The influence of wave steepness and age on wake dynamics and power performance of offshore wind farms, J. Applied Eng. 12, 07 (2026) [Google Scholar]
- L. Si, L. Xu, Z. Wang, Offshore wind farms can enhance the structural composition and functional dynamics of coastal waters, J. Global Ecology and Conservation, 64, 2 (2025) [Google Scholar]
- S. Christopher, Y. Haruki, Y. Ryota, Surge slow drift viscous drag damping of an advanced spar: A numerical experimental method for variable damping rates, J. Ocean Eng. 2, 6 (2022) [Google Scholar]
- M. Danny, A. Samson, K. Asbjorn, Technology legitimation and strategic coupling: A cross-national research of floating wind power in Norway and Scotland, J. Geoforum. 13, 5 (2022) [Google Scholar]
- J. Xue, D. Sandy, C. David, Analysis and real-time prediction of the full-scale thrust for floating wind turbine based on artificial intelligence, J. Ocean Eng. 17, 5 (2019) [Google Scholar]
- A. João, A. Bruno, P. Francisco, Offshore wind turbine tower design and optimization: A review and AI-driven future directions, J. Applied Energy. 39, 7 (2025) [Google Scholar]
- T. Muhammad, E. Jasim, O. Ottar, Digital twin-driven energy modeling of Hywind Tampen floating wind farm, J. Energy Reports. 28, 9 (2023) [Google Scholar]
Cite this article as: J. Zhu, Q. Zhao, Dynamic characteristics of floating offshore multi-turbine platforms with flexible constraints, Mechanics & Industry 27, 15 (2026), https://doi.org/10.1051/meca/2025035
All Tables
All Figures
|
Fig. 1 Mechanical analysis method for floating bodies on the sea. |
| In the text | |
|
Fig. 2 Offshore multi-wind power system. |
| In the text | |
|
Fig. 3 Floating free rod equivalent mass system. |
| In the text | |
|
Fig. 4 Axial force distribution at different load positions. |
| In the text | |
|
Fig. 5 Simplified model of integrated foundation for multiple wind turbines. |
| In the text | |
|
Fig. 6 Stress and deflection of model. |
| In the text | |
|
Fig. 7 Stress distribution under external force application. |
| In the text | |
|
Fig. 8 Comparison of stress results. |
| In the text | |
|
Fig. 9 Overall test platform. |
| In the text | |
|
Fig. 10 Wind testing system. |
| In the text | |
|
Fig. 11 Power system inspection. |
| In the text | |
|
Fig. 12 Stress–strain system detection. |
| In the text | |
|
Fig. 13 Aerodynamic load test model for multiple wind turbines. |
| In the text | |
|
Fig. 14 Physical model of mooring system. |
| In the text | |
|
Fig. 15 Wind load. |
| In the text | |
|
Fig. 16 Axial stress. |
| In the text | |
|
Fig. 17 Actual sea MWF response test. |
| In the text | |
|
Fig. 18 B1 cross brace stress. |
| In the text | |
Current usage metrics show cumulative count of Article Views (full-text article views including HTML views, PDF and ePub downloads, according to the available data) and Abstracts Views on Vision4Press platform.
Data correspond to usage on the plateform after 2015. The current usage metrics is available 48-96 hours after online publication and is updated daily on week days.
Initial download of the metrics may take a while.