| Issue |
Mechanics & Industry
Volume 27, 2026
|
|
|---|---|---|
| Article Number | 17 | |
| Number of page(s) | 13 | |
| DOI | https://doi.org/10.1051/meca/2026014 | |
| Published online | 21 April 2026 | |
Review
Detection of early plasticity in steel using large scale 4-point bending
1
LE3PI Laboratory, Univ. Cheikh Anta DIOP, Corniche West, BP 5085 Dakar-Fann, Senegal
2
Bystronic Group Industriestrasse 21, 3362 Niederönz, Suisse
3
SYMME, Univ. Savoie Mont Blanc, FR-74000 Annecy, France
* e-mail: This email address is being protected from spambots. You need JavaScript enabled to view it.
Received:
28
April
2025
Accepted:
8
March
2026
Abstract
Characterizing the early metallic plasticity of materials remains a challenge, as the stress–strain curve derived from a tensile test cannot accurately identify the first plastic deformations. Although tensile thermal camera coupling reveals an elastic limit lower than the conventional limit, it does not reveal incipient plasticity. The aim of this study is to develop an experimental setup and the method for detecting minimum plastic deformations before the classical yield strength determined by tensile testing is reached. An original large 4-point bending machine was designed to perform loading-unloading cycles and to analyze specimen profiles by detecting irreversible deformations, signs of early plasticity. Tests on the bending machine using dual-phase steels (DP600 and DP800) and cold-rolled low-carbon steel (DC01) specimens (1200 × 35 × (2 mm or 3 mm)) revealed the onset of irreversible strains occurring between 127–135, 154–169, and 64–68 MPa, respectively. These values are well below their respective yield strengths of 305, 360, and 158 MPa. These results confirm the existence of early plasticity and pave the way for the design of a behavioral model that takes this phenomenon into account, in response to the challenges posed by the prediction of springback during cold forming of metallic materials.
Key words: Plasticity / elastic limit / 4-point bending / thermal analysis / DP600 / DP800
© F.M. Diouf et al., Published by EDP Sciences, 2026
 This is an Open Access article distributed under the terms of the Creative Commons Attribution License (https://creativecommons.org/licenses/by/4.0), which permits unrestricted use, distribution, and reproduction in any medium, provided the original work is properly cited.
1 Introduction
Nowadays, to meet environmental and economic requirements and reduce CO2 emissions, the automotive industry is using lighter vehicles. However, this lightening must respect safety standards and the mechanical performance of structural components. This is driving steel manufacturers to develop new classes of high-performance steels, such as dual-phase (DP) steels, without reducing formability or increasing costs [1,2].
Dual-phase steels have a two-phase microstructure, i.e., a microstructure composed of a ferrite matrix (soft phase) in which martensite islands (hard phase) are embedded [3,4]. They have a low carbon content and are thermo-mechanically treated to achieve the required mechanical properties [5,6]. Particularly used in the automotive industry, these steels must be manufactured with precision. It is therefore important to know their springback after forming, which is the material's ability to return to its original shape [7,8]. Springback is caused by the release of internal stresses during the unloading phase of sheet metal forming [8,9,10]. It is influenced by several factors, such as mechanical properties (yield strength, Re, and Young's modulus, E), material thickness, radius of curvature, bending angle, bending method, and bending force [11]. Since the phenomenon of springback was first recognized, numerous relevant studies have contributed to its understanding and control. Among these is Wagoner's study of advanced springback issues [12]. Elastoplastic constitutive models have been the focus of growing attention in recent years, especially from an experimental point of view [13].
Some recent research has raised the question of early plasticity, a phenomenon observed in the deformation of metallic materials [14]. With this in mind, this study will focus on analyzing the mechanical behavior of metallic materials in order to contribute to the control of springback. In this respect, a fundamental aspect will be to propose an innovative method, enabling the early plasticity of metallic materials to be detected more accurately. This will be made possible by the use of the large-scale (XXL) 4-point bending machine, a state-of-the-art device developed within the SYMME laboratory [15]. This advanced experimental device allows for a detailed investigation of the deformation behavior of materials, with the capability to accurately detect the very onset of the elastoplastic transition, even before the conventional elastic limit is reached. Consequently, this study seeks to advance the early identification of elastoplasticity by proposing a methodological framework that is both more accurate and more efficient for the analysis of the elasticity of metallic materials.
The main objective of this study is to demonstrate that some materials adopt elastoplastic behavior before reaching the conventional elastic limit, challenging traditional methods of material characterization. This research proposes to explore an elastoplastic model, emphasizing that the onset of plasticity may occur from the very beginning of deformation, rather than after exceeding the elastic limit. To carry out this analysis, an XXL 4-point bending device is used, enabling accurate, measurable stresses to be applied while assessing material deformation. On the one side, the study focuses on DP600 and DP800, dual-phase steels, which are recognized for their high strength and ductility, making them relevant for observing deformation behavior under controlled conditions [16]. On the other side, the same analysis has been conducted on DC01 low-carbon steel, a mild cold-rolled steel widely used in industry for applications requiring good formability. Although its strength is lower than that of dual-phase steels, DC01 exhibits stable and predictable mechanical behavior, making it a relevant reference material for comparing deformation mechanisms and validating experimental models. By analyzing experimental results from 4-point bending tests, the study aims to gain a better understanding of the behavior of these steels under stress and to identify the transition between elastic and plastic phases [17]. The aim is to shed light on the mechanical response of these materials when subjected to loads, offering a new perspective on their behavior before reaching the traditional elastic limit [18].
This paper is structured in several distinct parts. The first part begins with a general introduction presenting the framework of the study, the objectives pursued, and the problem addressed. The second part describes the experimental trials carried out, including the methods used, the equipment employed, and the protocols followed. The third part presents the results obtained, followed by an in-depth analysis and discussion aimed at interpreting these data in the context of the research. Finally, the document concludes with a final section summarizing the main lessons learned from the study, as well as suggestions for future investigations.
2 Materials and methods
2.1 Materials
The studied materials are two dual-phase steels, DP600 and DP800, and a DC01 steel, all used for bending. The samples are cut from sheet form with a thickness of 2 mm for the DP grades and 3 mm for DC01. Dual-phase steels, also low-carbon, are characterized by a microstructure composed of ferrite, a soft phase, and martensite, a hard phase. After a specific thermomechanical treatment, they acquire the mechanical properties required for their application. These characteristics explain their widespread use in the automotive industry. DC01 is a low-carbon steel specially designed for cold rolling. Its versatility makes it a preferred choice for a variety of industrial applications. The chemical composition of these steels, obtained by spectrometry, is given in Table 1.
Chemical composition of studied steels.
2.2 Methods
2.2.1 Tensile test
The tensile test is a classical test used to determine the mechanical characterization of a material to determine its yield strength (Re), Young's modulus (E), mechanical strength (Rm), and elongation at break (A%) [19].
Tensile tests are carried out using an INSTRON 5596 machine equipped with a 50 kN force cell and a 12.5 mm long extensometer.
In this study, tests on DP600 and DP800 steels are carried out on standardized specimens with a thickness of 2 mm always cut in the same direction, the rolling direction.
The imposed displacement speed is 7 mm/min, i.e., a target strain rate of 3.3 10−3/s.
2.2.2 Tensile test with thermal camera
The use of an infrared camera allows parallel monitoring of temperature evolution during the tensile test [20]. The tests were carried out using the INSTRON 5569 machine and a thermal camera developed by FLIR, series A655sc, combined with Research IR software. The image acquisition frequency is 50 frames per second. For even greater accuracy, the camera is fitted with a macro lens, enabling measurements to be taken at focal lengths ranging from 10 to 18 cm. Displacement speed is 100 mm/min, i.e., a strain rate of 4.7 × 10⁻²/s. This speed was chosen to be as close as possible to the conditions of an adiabatic system and thus limit thermal diffusion with the tensile jaws in particular. In order to estimate temperature from thermal radiation measurements, the specimen was coated with a 0.97 emissivity paint [21]. The recorded temperature is the average temperature in the central zone of the specimen. In summary, the underlying assumptions of this study are as follows:
The measurements are taken at the center of this region in order to minimize boundary effects.
The central zone is assumed to be adiabatic, ensuring that the observed temperature rise originates solely from the thermoelastic effect.
A thermoelastic analysis is used for stripping, following the approach of Vitzthum et al. [17]. First, data are synchronized to the same time base. Next, a thermoelastic analysis is applied, consisting of plotting the variation of the temperature versus stress curve (Fig. 1, curve in blue) to identify and subtract the linear part (Fig. 1, green solid curve).
In this way, only the raise of temperature due to plastic work is retained. The final step is to find the first point where this rise of temperature exceeds the defined absolute threshold value. The threshold is defined as the linear temperature more or less three times the standard deviation of the residuals, where the residual represents the prediction error of the linear model. It is obtained by taking the difference between the measured temperature and the value predicted by the fitted linear model. The stress associated with this first point above the threshold is taken as an estimate of the yield point, defining the start of plastic strain. The threshold is illustrated by dashed green lines in Figure 1. In this illustrative example, yielding starts at 350 MPa. However, it can be observed that something already occurs from 300 MPa.
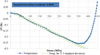 |
Fig. 1 Temperature versus stress curve for DP600 steel at the beginning of a tensile test. |
2.2.3 XXL bending test
Experimental setup
The large 4-point bending machine, called XXL 4-point bending machine, designed and developed at the SYMME laboratory, consists of a fixed lower beam and a movable upper beam. The movable beam is controlled by a handwheel connected to a spindle with a 4 mm pitch [15].
The punches A, B, C, and D are mounted on movable plates connected to an adjustable spindle along the x-axis, allowing dimensions a, b, and c to be adjusted. In this study, the dimensions are set at a = 250 mm and b = 500 mm. Force load cells are placed at points A, B, C, and D and measure forces in y directions, ensuring perfect symmetry of the applied load (Fig. 2). The load cells used are model DLM20-IN.501.TP3.M4, capable of measuring forces up to 500 N with a linearity deviation of less than 0.2%.
A profilometer integrated into the central part of the bending machine provides, for each value of x between B and C, the corresponding deflection y, enabling the bar profile to be traced, as shown in Figure 3. The sensor used is model OM70-L0140.HH0070.EK, capable of measuring distances between 40 and 120 mm, with a resolution varying between 1.2 and 2.5 µm.
The distinctive feature of this machine is that it provides a homogeneous mechanical state between points B and C, thereby amplifying the phenomenon while minimizing the influence of the supports compared with the constant central region.
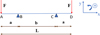 |
Fig. 2 4-point bending diagram. |
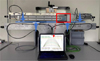 |
Fig. 3 XXL 4-point bending machine. |
Testing protocol
In this study, 4-point bending is used differently than usual. Indeed, the common use of 4-point bending is to apply a load to a test bar until failure is reached and thus measure its resistance to bending. In our situation, a series of charges and discharges will be performed. After each discharge, two situations may be envisaged, as illustrated in Figure 4:
No plastic strain, i.e., the bar returns to its initial position.
Appearance of plastic strain, i.e., the bar remains deformed.
 |
Fig. 4 Diagram of how to use the XXL 4-point bending device. |
XXL bending analysis methodology
In order to evaluate the experimental data obtained using the protocol described above, it is necessary to carry out strength of materials calculations based on the following assumptions: the neutral fiber of the specimen stays in the middle of the beam, and the material is supposed to be a continuous and homogenous material.
Computational part
Effect of weight
In the 4-point bending test, the deformation observed and calculated is due not only to the bending force but also to gravity: the weight of the one-meter beam is no longer negligible, especially in the case of small loads. Thus, to calculate the stress, the effect of weight must be taken into account in addition to the bending force. Figure 5 shows the neutral fiber during 4-point bending in the initial state.
Euler–Bernoulli beam theory is used to calculate bending moment Mfz and normal stress σw due to the weight. The curves for the evolution of moment and stress as a function of the position x are plotted in Figure 6.
The maximum value of the stress σ due to weight, estimated at 13.5 MPa, will be retained for subsequent calculations. This choice is intended to ensure that the conditions necessary for the initiation of plasticity are fully respected. The stress σwmax is incorporated into the bending stress evaluation to ensure a more accurate assessment of the stress state and to prevent potential underestimation, as shown in equation (1) below.
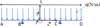 |
Fig. 5 Diagram of the neutral fiber of the bar during XXL 4-point bending with a load q representing 5.46 and 8.19 N/m for DP and DC01 steels, respectively. |
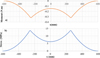 |
Fig. 6 (a) Weight moment curve along the neutral fiber. (b) Curve of normal stress due to weight along the neutral fiber. |
From bending force to stress
The normal stress in the beam is calculated regarding equation (1) with the notations defined in Figure 2. This relation is valid only between points B and C, within the elastic regime. The normal stress is expressed at the upper side of the beam.
 (1)
(1)
with t bar thickness, F bending force at A and D, at the distance AB, and I the moment of inertia

Considering that the detected onset of plasticity occurs at stress levels between approximately 60 and 170 MPa, the contribution of σwmax represents less than about 8–20% of the total stress level. The uncertainty introduced by using the maximum value instead of the spatially varying stress is therefore limited and remains acceptable within the framework of the present analysis.
From profile to strain
Figure 7 shows a profile of a DP600 steel bar subjected to a 2.8 N load. The profile is plotted from profilometer data.
In the same way, other loading and unloading profiles are plotted.
To calculate strain, Euler–Bernoulli beam theory is used, assuming that the neutral fiber lies at the center of cross section (Fig. 8). The profilometer provides the defection y of the superior fiber of the bar. R is then calculated using the formula  , where y″ is the second derivative of the interpolated deflection profile y(x) = C0x2 + C1x + C2, so that y″ = 2 × C0.
The radius of the neutral fiber ρ is obtained by removing the half-thickness t/2 of the beam.
The strain of the neutral fiber is therefore calculated as given in equation (2).
 (2)
(2)
The coordinate ζ ranges from −t/2 to +t/2 across the thickness.  , the strain at the superior fiber became:
 (3)
(3)
To evaluate the uncertainty associated with the strain measurement, the in-place accuracy of the profilometer was first considered. According to the sensor specifications, the measurement uncertainty on the vertical displacement y(x) is estimated to be ±10 µm.
To quantify the impact of this uncertainty on the strain calculation, a Monte Carlo–type numerical procedure was implemented. Starting from the measured profile, twenty synthetic profiles were generated by adding random perturbations to the measured deflection values y(x), with amplitudes normally distributed within the ± 10 µm measurement uncertainty.
For each perturbed profile, the same processing procedure as described previously was applied, and the strain was finally computed using equation (3).
The strain values obtained from the twenty perturbed profiles were then analyzed statistically. The standard deviation of the resulting strain distribution was found to be 7 × 10⁻⁸, which provides an estimate of the uncertainty associated with the strain measurement.
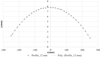 |
Fig. 7 Loading profile on DP600 under 2.8 N. |
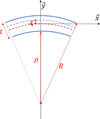 |
Fig. 8 Element of a curved beam. |
Detection of elasto-plasticity onset
The residual strain corresponds to the strain of the specimen after unloading. It is determined from the unloaded profiles. The onset of plasticity is identified by plotting residual strain versus loading stress and defining a limit zone as in (4). So, the stress at the first point outside the limit zone represents the stress at the start of plasticity and is what can be called the elastic limit.
 (4)
(4)
where the noise represents the zone where residual deformation evolves in a non-stable form. The standard deviation represents the dispersion of the data around the average.
3 Results and discussion
3.1 Tensile test
Table 2 summarizes the yield strength of DP600, DP800, and DC01 steels according to rolling direction, the tests having been carried out under the same conditions.
In this study, the classic yield stress (Re) is defined as the point at which a material transitions from purely elastic (reversible) behavior to the onset of plastic (permanent) deformation. In the initial regime, the stress–strain relationship follows Hooke's law, with a slope determined by Young's modulus. Young's modulus is determined using a linear interpolation between 20 and 150 MPa for DP steels and between 20 and 50 MPa for DC01 steel; the values of Young's modulus are summarized in Table 2.
These results show a large difference between the classical yield strength (Re) and the normalized yield stress at 0.2% (Re0.2%). In fact, these materials do not exhibit the phenomenon of Lüders bands and placing them at 0.2% strain leads to a significant increase in the value of the stress. To avoid having to choose between 0 and 0.2% strain, the approach previously reported in the literature [17] was used: employing a thermal camera to detect the onset of plasticity.
Young's modulus and yield strengths summary table.
3.2 Tensile test with thermal camera
During the purely elastic deformation phase, temperature linearly decreases due to the thermoelastic effect: the application of stress causes the material to elongate, increasing its volume, and triggering cooling. In the plastic phase, on the other hand, energy is dissipated in the form of heat, leading to a rise in temperature [10,16,22].
Figure 9 shows a plot based on the methodology given in the experimental section. Based on the method described in the infrared section (2.2.2) and following the procedure illustrated in Figure 1, the stress values corresponding to the onset of plasticity were determined. These values were found to range between 345 and 396, 400 and 419, and 187 and 200 MPa for DP600, DP800, and DC01 steels, respectively. As illustrated in Figure 1 for DP600, a linear temperature trend can be observed in the curve prior to reaching this limit. These values represent the minimum and maximum of the two tests done for each material.
These results show that, similar to the standard tensile test, the tensile test combined with the infrared camera struggles to detect this early plasticity, although it appears that some phenomena occur before reaching this limit. Hence the interest in going one step further by designing and building the XXL bending machine, enabling us to zoom in on what is happening at very small strains.
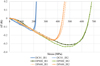 |
Fig. 9 Temperature versus stress curve for DC01, DP800, and DP600 steels during tensile test. |
3.3 4-point bending test
The results of 4-point bending tests on DP600, DP800, and DC01 steels are presented in this section. The tests were repeated three times to ensure repeatability. One of the tests is shown for DP800 (Fig. 10) with the 14 profiles and their polynomial interpolations for different displacements of the handwheel (i.e., for different bending loads).
Strain and stress from XXL bending shown in Figure 11a are calculated using equation (1) and (3).
They were superimposed on those obtained in the conventional tensile test. Next to Figure 11b, the tensile curves of the different grades are presented.
The results indicate that the stress–strain curve obtained from XXL bending data shows a similar evolution to that observed for the tensile curve.
The scatter observed in Figure 11b is consistent with the typical variability of mechanical properties in sheet steels, which may arise from microstructural heterogeneity and experimental variability. The magnitude of this dispersion remains within the usual range reported for similar materials.
Figure 12 shows the plots of residual strain as a function of the applied stress. The strain is evaluated at the upper surface of the beam (ζ = +t/2), which is identical up to a sign to that at (ζ = –t/2) under the adopted hypotheses.
Plasticity is detected for different ranges of stresses, that is to say, when the residual strain is no longer in the range of the noise (average value ± 3 standard deviation). These values indicate the stresses before and after the onset of early plasticity obtained in the tests.
Table 3 shows a summary of the different yield strengths obtained with the tensile test, the tensile test coupled with the thermal camera and the XXL 4-point bending test.
These results indicate that application of the 4-point bending method to DP600 and DP800 dual-phase steels enables early plasticity to be detected, around 42–47%, before the elastic limit point (Re) is reached. This observation applies to dual-phase steels, characterized by a two-phase microstructure consisting of a hard and a soft phase. This early plasticity may be explained by the difference in behavior between these phases, leading to preferential deformation of some zones over others, as some studies suggest [23]. More analyses should be done to check the potential link with material microstructure. Bending tests were also carried out on DC01 steel, which showed irreversibility around 64–68 MPa, stress well below the elastic limit of 158 MPa. The “zoom” effect of the large bending machine, characterized by the application of a low force for small deformations perceptible thanks to large scale, makes it possible to detect early plasticity while maintaining the same shape as the stress–strain curve obtained in tension.
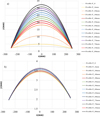 |
Fig. 10 (a) Measured profiles of the DP800 specimen during loading for different imposed displacements. (b) Profiles measured after unloading, showing the residual deformation of the specimen. The profile corresponding to the initial profile P_0 is measured under self-weight. |
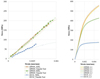 |
Fig. 11 (a) Stress–strain curves for DP600, DP800, and DC01 obtained by tensile test and XXL bending test. (b) Stress–strain curves for DP600, DP800, and DC01 during tensile test. |
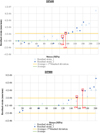 |
Fig. 12 Residual strain as a function of applied stress for (a) DP600, (b) DP800 and (c) DC01 for ζ = t/2. |
Table summarizing the different elastic limits for DP600, DP800, and DC01 steels.
4 Conclusion
The aim of this study was to observe and quantify the early plasticity of materials, which emerges well before the theoretical yield stress, using the XXL 4-point bending machine. To achieve this, tensile tests and tensile tests coupled with a thermal camera were first conducted in order to confirm the hypothesis of early plasticity. The thermal measurements provide stress values around the elastic limit (Re). Nevertheless, it can be observed that some phenomena occur prior to reaching this limit. Subsequently, 4-point bending tests were performed on DP600, DP800, and DC01 steels, highlighting the ability of this technique to detect the onset of the elastoplastic transition at an even earlier stage.
The results indicate yield strengths of approximately 135, 169, and 69 MPa for DP600, DP800, and DC01 steels, respectively, which are notably lower than the conventional values of 305, 360, and 158 MPa. Rather than a simple discrepancy, this difference points to the existence of an earlier elastoplastic transition, where microscopic plasticity phenomena begin before the conventional yield point determined by tensile testing. These findings highlight the sensitivity of the 4-point bending method in capturing this gradual transition, offering a more refined perspective on the onset of plastic deformation. In this context, the 4-point bending method can be considered a complementary approach for detecting the onset of the elastoplastic transition, providing additional insight into the early stages of material deformation.
Complementary microstructural analyses could be carried out in future work to provide additional insight into the mechanisms associated with the observed onset of plasticity.
In the future, it would be interesting to develop a behavior model that takes this elasto-plasticity into account. This would probably improve springback prediction and enable us to obtain dimensionally accurate parts. It would also be necessary to consider the design of new plasticity surfaces.
Acknowledgments
This work was done as part of PhD theses of two of co-authors.
Funding
We would like to express our gratitude to Campus France and its EIFFEL program for funding for mobilities of involve research.
Conflicts of interest
The authors declare that they have no conflict of interest.
The authors declare that this study was conducted in compliance with applicable ethical principles. No experiments involving human beings or animals were carried out as part of this research.
Data availability statement
All relevant data are available from the authors.
Author contribution statement
All authors participated in the study and agreed with this version of the manuscript. Conceptualization–methodology–Writing—Original Draft Preparation, all authors; Review & Editing, Fatoumata Mbissine DIOUF.
References
- F.S.M. Mballa, Modélisation du comportement magnéto-mécanique d'un acier Dual Phase à partir de sa description microstructurale, PhD thesis, Ecole Normale Supérieure de CACHAN, 2013 [Google Scholar]
- M. Ollat, Characterization and modeling of microstructural evolutions during the thermal treatment of cold-rolled Dual-Phase steels, PhD thesis, Université de Lyon, 2017 [Google Scholar]
- C.C. Tasan, M. Diehl, D. Yan, M. Bechtold, F. Roters, L. Schemmann, C. Zheng, N. Peranio, D. Ponge, M. Koyama, K. Tsuzaki, D. Raabe, An overview of dual-phase steels: advances in microstructure-oriented processing and micromechanically guided design, Annu. Rev. Mater. Res. 45, 391–431 (2015) [CrossRef] [Google Scholar]
- O. Çavuşoğlu, S. Toros, H. Gürün, Microstructure based modelling of stress–strain relationship on dual phase steels, Ironmak. Steelmak. 46, 313–319 (2019) [Google Scholar]
- I. Pushkareva, Evolution microstructurale d'un acier Dual Phase. Optimisation de la résistance à l'endommagement, PhD thesis, Université de Lorraine, 2009 [Google Scholar]
- Y. Gabi, Modélisation FEM du système de contrôle non destructif 3MA en ligne de production des aciers dual phase, PhD thesis, Université de Grenoble, 2012 [Google Scholar]
- B. Haddag, Contribution à la modélisation de la mise en forme des tôles métalliques : application au retour élastique et à la localisation, PhD thesis, École Nationale Supérieure d'Arts et Métiers, 2007 [Google Scholar]
- P.A. Eggertsen, K. Mattiasson, On constitutive modeling for springback analysis, Int. J. Mech. Sci. 52, 804–818 (2010) [CrossRef] [Google Scholar]
- X. Li, Y. Yang, Y. Wang, J. Bao, S. Li, Effect of the material-hardening mode on the springback simulation accuracy of V-free bending, J. Mater. Process. Technol. 123, 209–211 (2002) [Google Scholar]
- R.M. Cleveland, A.K. Ghosh, Inelastic effects on springback in metals, Int. J. Plast. 18, 769–785 (2002) [CrossRef] [Google Scholar]
- J.R. Cho, S.J. Moon, Y.H. Moon, S.S. Kang, Finite element investigation on spring-back characteristics in sheet metal U-bending process, J. Mater. Process. Technol. 141, 109–116 (2003) [Google Scholar]
- R.H. Wagoner, H. Lim, M.G. Lee, Advanced issues in springback, Int. J. Plast. 45, 3–20 (2013) [Google Scholar]
- F. Pierron, M. Grédiac, Towards material testing 2.0. a review of test design for identification of constitutive parameters from full-field measurements, Strain 57, e12370 (2021) [CrossRef] [Google Scholar]
- J. Lee, J.Y. Lee, F. Barlat, R.H. Wagoner, K. Chung, M.G. Lee, Extension of quasi-plastic–elastic approach to incorporate complex plastic flow behavior—application to springback of advanced high-strength steels, Int. J. Plast. 45, 140–159 (2013) [Google Scholar]
- W. Liegard, L. Tabourot, P. Balland, Characterization of elasto-plastic transition of sheet metal by using large-scale four-point bending test, IOP Conf. Ser. Mater. Sci. Eng. 1238, 012057 (2022) [Google Scholar]
- L. Topilla, S. Toros, Mechanical behaviour of dual phase steels under different strain rates, Kemija u industriji, 72, 151–159 (2023) [Google Scholar]
- S. Vitzthum, J.R. Kornmeier, M. Hofmann, M. Gruber, E. Maawad, A.C. Batista, C. Hartmann, W. Volk, In-situ analysis of the thermoelastic effect and its relation to the onset of yielding of low carbon steel, Mater. Des. 219, 110753 (2022) [Google Scholar]
- S. Vitzthum, J.R. Kornmeier, M. Hofmann, M. Gruber, R. Norz, E. Maawad, J. Mondegreen, W. Volk, In-situ analysis of the elastic-plastic characteristics of high strength dual-phase steel, Mater. Sci. Eng. A 857, 144097 (2022) [Google Scholar]
- E. Gdoutos, M. Konsta-Gdoutos, Mechanical Testing of Materials, Springer, Cham, 1–34, 2024 [Google Scholar]
- E. Roux, P. Balland, C. Elmo, L. Charleux, Physics-informed Gaussian processes model for heat source identification, Mater. Today Commun. 47, 112892 (2025) [Google Scholar]
- C. Kinkelin, Etude expérimentale d'un amortisseur thermique composite MCP-NTC, PhD thesis, Université de Lyon, 2016 [Google Scholar]
- K.N. Pandey, S. Chand, Deformation based temperature rise: a review, Int. J. Press. Vess. Pip. 80, 673–687 (2003) [Google Scholar]
- L. Charleux, L. Tabourot, E. Roux, M.I. Farah, L. Bizet, Dependency of the Young's modulus to plastic strain in DP steels: a consequence of heterogeneity? Mater. Today Commun. 24, 100972 (2020) [Google Scholar]
Cite this article as: F.M. Diouf, W. Liegard, L. Tabourot, N. A. Sene, E. Roux, P. Balland, Detection of early plasticity in steel using large scale 4-point bending, Mechanics & Industry 27, 17 (2026), https://doi.org/10.1051/meca/2026014
All Tables
Table summarizing the different elastic limits for DP600, DP800, and DC01 steels.
All Figures
|
Fig. 1 Temperature versus stress curve for DP600 steel at the beginning of a tensile test. |
| In the text | |
|
Fig. 2 4-point bending diagram. |
| In the text | |
|
Fig. 3 XXL 4-point bending machine. |
| In the text | |
|
Fig. 4 Diagram of how to use the XXL 4-point bending device. |
| In the text | |
|
Fig. 5 Diagram of the neutral fiber of the bar during XXL 4-point bending with a load q representing 5.46 and 8.19 N/m for DP and DC01 steels, respectively. |
| In the text | |
|
Fig. 6 (a) Weight moment curve along the neutral fiber. (b) Curve of normal stress due to weight along the neutral fiber. |
| In the text | |
|
Fig. 7 Loading profile on DP600 under 2.8 N. |
| In the text | |
|
Fig. 8 Element of a curved beam. |
| In the text | |
|
Fig. 9 Temperature versus stress curve for DC01, DP800, and DP600 steels during tensile test. |
| In the text | |
|
Fig. 10 (a) Measured profiles of the DP800 specimen during loading for different imposed displacements. (b) Profiles measured after unloading, showing the residual deformation of the specimen. The profile corresponding to the initial profile P_0 is measured under self-weight. |
| In the text | |
|
Fig. 11 (a) Stress–strain curves for DP600, DP800, and DC01 obtained by tensile test and XXL bending test. (b) Stress–strain curves for DP600, DP800, and DC01 during tensile test. |
| In the text | |
|
Fig. 12 Residual strain as a function of applied stress for (a) DP600, (b) DP800 and (c) DC01 for ζ = t/2. |
| In the text | |
Current usage metrics show cumulative count of Article Views (full-text article views including HTML views, PDF and ePub downloads, according to the available data) and Abstracts Views on Vision4Press platform.
Data correspond to usage on the plateform after 2015. The current usage metrics is available 48-96 hours after online publication and is updated daily on week days.
Initial download of the metrics may take a while.