| Issue |
Mechanics & Industry
Volume 27, 2026
Overview of recent advances in research for next generation in Mechanical Engineering
|
|
|---|---|---|
| Article Number | 23 | |
| Number of page(s) | 11 | |
| DOI | https://doi.org/10.1051/meca/2026019 | |
| Published online | 19 May 2026 | |
Original Article
Quantitative visualization of flows upstream and downstream of an obstacle impinged by a jet using two synchronized S-PIV: application to aeroacoustics
1
La Rochelle University (ULR), LaSIE, Technoforum, 23 Avenue Albert Einstein, BP 33060, 17031 La Rochelle, France
2
Mechanical Engineering Department, Beirut Arab University, Lebanon
3
Mechanical Engineering Department, Prince Mohammad Bin Fahd University, Al Khobar 31952, Saudi Arabia
* e-mail: This email address is being protected from spambots. You need JavaScript enabled to view it.
Received:
25
November
2025
Accepted:
27
March
2026
Abstract
The results presented here concern studies related to air treatment and ventilation flows in habitable enclosures. These studies fall within a broader context involving human health and well-being, comfort, indoor environmental quality, and energy savings. In certain configurations, impinging jets used in such enclosures can generate whistling noises, which are perceived as acoustic nuisances. To address this issue, the characteristics of the vortex structures generated by jets interacting with ventilation openings and the noise produced by a jet impinging on a slotted surface were studied experimentally. Experiments were conducted for an impingement distance of 4 cm and two Reynolds numbers, 4700 and 4800. A dedicated experimental setup was designed for this study to enable a quantitative analysis of the correlations between vortex dynamics upstream and downstream of the slotted plate and the radiated acoustic field, using a dual stereo-PIV configuration combined with microphones. The results show that, when transitioning from Re = 4700 to Re = 4800, the acoustic pressure level drops by 8 dB. Spectral analysis reveals a shift from a self-sustained tonal feedback loop at a single frequency (204 Hz) to a dual-frequency loop (129 and 270 Hz). The analysis of vortex dynamics, using the Lambda-2 criterion, indicates that this drop is associated with a transition from a symmetric to an antisymmetric vortex organization. The spectral analysis of velocity signals extracted from the S-PIV measurements makes it possible to interpret all acoustic frequencies and identify the sources of the acoustic noise. The use of correlation functions between acoustic and velocity signals confirms the presence of aeroacoustic coupling.
Key words: Acoustic comfort / aeroacoustic noise / turbulent jet / PIV
© N.E. Afyouni et al., Published by EDP Sciences, 2026
 This is an Open Access article distributed under the terms of the Creative Commons Attribution License (https://creativecommons.org/licenses/by/4.0), which permits unrestricted use, distribution, and reproduction in any medium, provided the original work is properly cited.
1 Introduction
France has made ambitious commitments to stabilize greenhouse gas emissions and reduce energy consumption. The building sector is particularly affected by these goals. Of all economic sectors, it is the largest energy consumer, accounting for 43% of national energy use. Moreover, housing alone represents 30% of household budgets, with air conditioning costs constituting a significant portion of these expenses.
At the local level, many municipalities and intercommunal bodies have prioritized sustainable development. Among the many initiatives launched in this regard, noise, housing, and energy stand out as key concerns. Therefore, we have initiated a research theme of high economic, environmental, and societal relevance. The objectives of the proposed study are well aligned with this context, focusing on the control and improvement of indoor environments (ventilation, acoustics, indoor air quality, etc.). Optimizing mixing while maintaining acoustic comfort would lead to energy savings and improvements in both aerodynamic and acoustic comfort within inhabited spaces.
When an air jet impacts a surface with geometrical singularities, such as the slots found on air supply diffusers, vortex structures are generated and convected by the flow. Under certain confinement conditions, these vortices can produce self-sustained acoustic tones. Indeed, flow-induced noise is the result of aeroacoustic coupling, and to mitigate these acoustic nuisances, it is essential to identify the parameters that amplify the phenomenon, visualize and track the vortex structures, and analyze their correlation with the radiated acoustic field.
As the jet exits the nozzle, shear between the injected fluid and the quiescent ambient fluid leads to vortex shedding. These vortices propagate with the flow and impact the solid surface in front of the jet. In the presence of a geometrical singularity, the vortices interact with it and become distorted. This deformation induces an energy conversion process, transferring part of the kinetic energy into acoustic energy. The radiated acoustic wave then propagates backward in the fluid and perturbs the shear layer at the jet exit, triggering a new vortex shedding event, and so on. This feedback mechanism is the source of a characteristic acoustic emission known as a self-sustained tone [1].
Lighthill [2] derived an equation from the Navier–Stokes equations to describe the generation of sound by turbulent flows. He considered the noise source to be linked to turbulence fluctuations, represented by the Lighthill stress tensor. However, this model did not account for fluid-structure interaction. Powell [3] extended Lighthill’s theory to include the role of vortices in sound generation. He formulated a model where noise is directly related to the moments of vortex convection forces. Howe [4] further developed this theory by including vortex interaction with a surface singularity. According to Howe’s model, the acoustic power generated by a vortex is proportional to the scalar triple product of the vortex convection velocity, the vorticity field, and the acoustic velocity. For the transfer of kinetic energy to the acoustic field to occur, certain conditions must be met: non-zero vorticity in the flow, a non-zero angle between vorticity and vortex convection velocity, and an optimal angle between the cross product of the convection velocity and vorticity vectors and the acoustic velocity vector in order to maximize the acoustic energy transfer.
Due to the analytical complexity of the model and the difficulty of measuring acoustic velocity, experimental studies have been developed to better understand the aeroacoustic coupling. In this context, Zhang [5] investigated sound generation by impinging jets using time-resolved particle image velocimetry (TPIV), hot-wire anemometry (HWA), and acoustic measurements. Vortex structures were visualized via contours of the velocity gradient. It was observed that combustion increased the acoustic emission, while the presence of a turbulence generator had little effect on noise levels. Chanaud and Powell [6] studied specific cases of impinging jets: hole tones and ring tones. They found similar behavior with differences in sound directivity and occurrence zones in the Reynolds–Strouhal diagram. Ho and Nosseir [1] confirmed that a feedback loop mechanism is responsible for acoustic noise in impinging jets with short nozzle-to-surface distances by measuring near-field pressure. They explained that the feedback loop consists of two components: one related to coherent vortex convection and the other to vortex impact on the plate.
Billon et al. [7] were the first to study slot noise using a rectangular jet impinging on a slotted plate. The slot had the same dimensions as the jet exit. Various Reynolds numbers and impingement distances were tested, revealing that acoustic pressure is highly dependent on Reynolds number. Following this work, Assoum et al. [8–10] analyzed the aeroacoustic coupling between acoustic and transverse velocity signals using PIV measurements. Spectral and cross-correlation analyses, along with pre-whitening techniques, were applied. They showed that the correlation between the signals exhibits a peak corresponding to the passage of dominant Kelvin–Helmholtz vortices.
Dhamanekar and Srinivasan [11] studied the effect of surface roughness on sound generation in impinging jets. They found that surface roughness extended the onset region of impact noise, leading to lower noise levels compared with smooth surfaces. Akamine et al. [12] experimentally studied the acoustic emission of a supersonic jet impinging on an inclined plate. They focused on acoustic pressure levels, spectra, and directivity, showing the existence of two types of acoustic waves: one at 5 kHz propagating at 30° and another at 12 kHz at 75°, indicating two distinct source mechanisms. The authors also studied the effect of impingement distance and found that at short distances (5D, where D is the nozzle diameter), only impact-induced waves propagate at 75°, while at larger distances, Mach waves also appear.
Gijon and Bogey [13] numerically examined the effect of impact angle on aeroacoustic feedback mechanisms in supersonic impinging jets using compressible LES. They found that the impact angle affects the feedback loop mode. Hamdi et al. [14–18] further investigated slot noise using tomographic PIV. Their results confirmed the bidimensionality of the jet far from the edge, encouraging future SPIV measurements, which require less computational effort and data storage. Alkheir et al. [19, 20] proposed a control mechanism using a 4 mm rod placed in the flow direction to reduce slot noise. The mechanism was effective when positioned in a specific region but affected the mass flow rate through the slot.
Although slot noise has been studied for decades, the correlation between noise generation and flow dynamics remains incomplete, particularly due to the lack of data on vortex behavior near and beyond the slot.
This article investigates an impinging jet configuration with a slotted plate at an impingement ratio L/H = 4 (where L is the distance between the jet exit and the plate, and H is the height of the planar jet and the slot). Two simultaneous and synchronized stereoscopic PIV (SPIV) measurements were performed to obtain kinematic fields both upstream and downstream of the plate, allowing vortex tracking through the slot to understand the post-impact behavior of turbulent structures. Two Reynolds numbers were investigated: Re = 4700 and Re = 4800. The flow at Re = 4700 generates significant noise, whereas the slightly higher Reynolds number, Re = 4800, produces a lower sound level. These observations are based on acoustic measurements performed over a range of Reynolds numbers, under identical conditions, allowing the variation of the sound pressure level (SPL) as a function of Reynolds number to be plotted. The results reveal a marked drop in SPL between these two Reynolds numbers. This article focuses on acoustic spectra and vortex dynamics to understand the cause of acoustic level differences between the two flows.
2 Material and methods
Figure 1 presents a schematic illustration of the experimental jet setup, which includes a compressor (1) controlled by a frequency inverter (2). This system regulates the motor power to adjust the airflow rate and, consequently, the jet velocity. The airflow then passes through a buffer volume (3) of 1 m3, which serves to stabilize the flow, ensure proper mixing of air with the tracer particles used for PIV measurements, and filter out external frequency disturbances. The buffer volume is followed by a duct (4) measuring 1250 mm in length with a rectangular cross-section (190 × 90 mm). This duct extends into a convergent section (5) with an outlet height of H = 10 mm and a width of Lz = 190 mm, resulting in an aspect ratio Lz/H = 19, indicating that the jet can be considered two-dimensional [21]. The generated air jet then enters the experimental chamber, as seen in Figure 1, and impacts an aluminum plate (6) with a thickness of 4 mm and dimensions of 250 × 250 mm. This plate features a beveled slit inclined at 45° (7), with dimensions identical and aligned with the exit of the convergent section. To control the jet temperature, the air is drawn from a room adjacent to the experimental chamber, maintaining a temperature range of 18 to 20°C. Consequently, the Reynolds number depends solely on the jet velocity, which is regulated by the frequency inverter. The distance L between the jet exit and the slotted plate is adjustable using the ISEL MS 200 HT2 Direkt L690 mm displacement system. Based on previous studies, the dimensionless distance L/H = 4 is used, as this value corresponds to a high SPL [22].
Aeroacoustic noise is recorded using two B&K 4189 microphones, positioned directly behind the slotted plate, symmetrically with respect to the vertical axis of the plate, and 4 cm below the slit axis in order to prevent the airflow from directly impinging on the microphones. Data acquisition is performed using LabVIEW software installed on a National Instruments NI PXI 1036 workstation, equipped with an NI PXI 4496 dynamic data acquisition card. The sampling frequency for acoustic measurements is set to 20 kHz, and the recording duration is one second, matching the acquisition period of the SPIV measurements. The use of two microphones ensures the reliability of acoustic measurements, with results showing that the SPL values recorded by both microphones are nearly identical.
For flow visualization, dual stereoscopic particle image velocimetry (D-SPIV) is used, as illustrated in Figure 1. D-SPIV consists of two separate yet synchronized S-PIV measurements. To generate light sheets, an LD-527 PIV laser system is used. This laser emits a 30 mJ beam at an optimal frequency of 1 kHz and a wavelength of 527 nm. It contains two cavities that allow for the emission of two separate pulses, with an adjustable time interval depending on the flow properties. In this study, the acquisition was performed at a sampling frequency of 3 kHz over a one-second duration (which is sufficient to visualize the passage of vortex structures), providing a pulse energy of 17 mJ per pulse. The laser beam is transmitted to a light sheet generator via a mirror arm capable of transmitting 97% of the light power. Behind this mirror arm, a beam splitter is used. This splitter consists of a 50/50 lens, dividing the incident beam into two beams: the first transmitted beam is directed toward the first light sheet generator, while the second reflected beam is redirected by this 50/50 lens toward a 45° mirror, which reflects it again toward a second light sheet generator, illuminating the region behind the plate. The laser sheet thickness is approximately 10 mm. Using an analytical estimate of the dissipation rate based on εu′3/H, the Taylor microscale is estimated to be approximately 1.8 mm. Therefore, the laser sheet thickness corresponds to about 5.5 times the Taylor microscale. Since the Taylor microscale represents an intermediate turbulent scale rather than the largest flow structures, this thickness is expected to adequately capture the relevant turbulent motions while limiting out-of-plane particle motion.
Four high-speed cameras with high acquisition rates (7400 images per second at full resolution) are used in this experiment. Two cameras are employed for the first SPIV measurement in the xy plane upstream of the plate, and two cameras are used for the second SPIV measurement in the xy plane downstream of the plate. The first two cameras are Phantom VEO 710, while the other two are Phantom V711L. All four cameras are equipped with CMOS sensors with a maximum resolution of 1200 × 800 pixels2. Additionally, they feature a Scheimpflug adapter to correct blurriness caused by camera rotation. Calibration is performed using a 3D calibration target produced by LaVision, which is detectable by the Davis software. The cameras are synchronized with the laser through a programmable synchronization unit (TPU X), also produced by LaVision. This TPU generates pulse trains that ensure synchronization between the cameras and the laser, as well as between the SPIV measurements and the acoustic acquisition. It is controlled by Davis 10 software and is simultaneously connected to LabVIEW via a trigger signal. When an acoustic measurement is initiated, a signal is sent to the TPU, instructing the cameras to capture images of the flow. The flow is seeded with olive oil particles, generated by an oil-air atomizer using a Laskin nozzle. The Δt between two successive images is chosen so that the displacement of the particles in the fastest region of the flow does not exceed one-quarter of the correlation window size [23]. Therefore, Δt = 50 μs is selected. Regarding spatial resolution, a 32-pixel window (3.03 mm) with a 75% overlap rate is used, resulting in a spatial resolution of 0.7575 mm. This resolution is highly satisfactory, as the cell size is on the order of 12% of the largest eddies (Taylor scale) and comparable to the smallest generated eddies (Kolmogorov scale). This allows both large and small eddies to be resolved. However, in this study, the focus is on the large-scale structures responsible for the generation of the feedback loop. Once the window size is adapted, Davis software applies the intercorrelation method to all windows of the two successive images to calculate the velocity field in each region. Consequently, the position of the correlation peak relative to the window center corresponds to a particle displacement Δd between the two instants t and t + Δt, providing the flow velocity at that point: V = Δd/Δt.
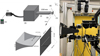 |
Fig. 1 Schematic representation of the jet facility: (1) frequency chopper, (2) compressor, (3) stabilizing chamber, (4) duct, (5) nozzle, (6) slotted plate, (7) slot (left). Photo of the experimental setup consisting of double SPIV before and behind the slotted plate and two microphones (right). |
3 Results
The amplitude spectra of the acoustic signals recorded by the microphones are presented in Figure 2. Spectral analysis shows that, for the first Reynolds number Re = 4700, the spectrum contains a fundamental frequency f = 204 Hz and its first harmonic f = 408 Hz, with a corresponding sound pressure level Lp = 80 dB. However, for the second Reynolds number Re = 4800, the spectrum contains two dominant frequencies f1 = 129 Hz and f2 = 270 Hz, with a corresponding sound pressure level Lp = 72 dB. Thus, a decrease of 8 dB is observed when transitioning from Re = 4700 to Re = 4800. Furthermore, frequency analysis shows that the first flow corresponds to a feedback loop with a single frequency of 204 Hz, whereas the second flow corresponds to a feedback loop with two frequencies, 270 and 129 Hz. To explain the difference in the acoustic behavior of the two studied flows, the results of SPIV measurements are analyzed.
Figure 3 shows the raw particle images acquired by the cameras at different measurement instants, both upstream and downstream of the slotted plate, for the two studied flows at Re = 4700 and Re = 4800.
It can be observed that the first flow corresponds to a symmetric organization of the vortical structures: these structures maintain their symmetric arrangement as they propagate with the flow. This organization remains nearly symmetric downstream of the plate, indicating that the arrangement of vortical structures in the flow downstream of the plate is dictated by the jet impinging on the slotted surface. For the second flow, the vortical structures appear antisymmetric relative to the jet axis, meaning that they impact the plate with a temporal shift. This organization of vortical structures is transmitted downstream of the plate, resulting in an antisymmetric arrangement in this region. Comparing the two studied flows, the main difference in vortex dynamics lies in the organization of the vortical structures.
To confirm the spatial organization of the vortices, the λ2 criterion was applied to the instantaneous velocity fields obtained from SPIV measurements. The results corresponding to time t = 0 s are presented in Figure 4. For the first Reynolds number (Re = 4700), the flow exhibits a symmetric arrangement of vortical structures on either side of the jet axis. This symmetry is mostly preserved downstream of the slotted plate, indicating that the coherent structures largely maintain their organization through the impact and across the aperture. In contrast, for the second Reynolds number (Re = 4800), the λ2 field clearly reveals an antisymmetric arrangement of vortices at the same instant. This antisymmetry is likewise preserved downstream of the plate, suggesting a consistent vortex configuration both upstream and downstream of the impact region. To reinforce these observations, a time-resolved analysis was conducted on a sequence of 100 instantaneous velocity fields. The results confirm that the symmetric configuration remains stable over time for Re = 4700, while the antisymmetric pattern dominates for Re = 4800. These findings imply that the transition from a symmetric to an antisymmetric vortex configuration is a robust feature of the flow dynamics associated with the change in Reynolds number. Consequently, it can be concluded that the observed reduction in acoustic pressure levels (8 dB drop) between the two flow regimes is directly linked to the modification in vortex arrangement. Additionally, the persistence of the same vortex structure before and after the slotted plate suggests that the interaction with the singularity (the slot) does not significantly disrupt the organization of the coherent structures but rather transmits it downstream. This structural coherence plays a key role in the efficiency of the aeroacoustics feedback mechanism and thus in the generation of sound.
To understand the differences in the acoustic behavior between the two studied flows, a spectral analysis of the kinematic field was carried out. The transverse velocity was extracted as a function of time from the 3000 PIV measurements at various points in the flow corresponding to vortex passages, as shown in Figure 5. An FFT was then applied to the temporal signal to obtain the transverse velocity spectrum. The transverse velocity component corresponds to the v velocity at points A, B, C, D, G, H, I, J, K, and L, while it corresponds to the u velocity at points E and F. Exceptionally, at point O, the u velocity is plotted because the amplitude of the v velocity is too small to allow a reliable amplitude spectrum to be obtained. The choice of the transverse velocity component is motivated by the fact that this component changes sign as a vortex passes through the measurement point, which enables a clearer and more periodic variation of the velocity signal. Because of the symmetry of the measurement points, the spectra obtained in the upper part of the jet were found to be identical to those from the corresponding points in the lower part. Therefore, only the spectra from the upper part of the jet, both upstream and downstream of the flow, will be presented.
Figure 6 shows the transverse velocity spectra at points A, C, E, O, G, I, and F. At points A and B, the dominant frequency in the velocity spectrum is 204 Hz. Moving to points C and D, five distinct frequencies appear: 204, 71, 133, 275, and 337 Hz, along with the first harmonic of 204 Hz (408 Hz). Among these, 204 Hz remains the dominant frequency. In contrast, at points E and F, the spectrum of the u-component shows only the 71 Hz frequency. At point O, both 204 Hz and its first harmonic (408 Hz) are observed, corresponding to the frequency of acoustic emission. This indicates that the deformation of vortex structures occurs at 204 Hz. Downstream of the slotted plate, the velocity spectrum at point G exhibits five frequencies: 133, 204, its harmonic 408, 275, and 337 Hz, with 204 Hz still dominant. Similarly, at point H, the 204 Hz frequency and its harmonic remain the most energetic, although other frequencies are present at much lower amplitudes. The spectra at points I and L resemble that of point G, featuring 71, 133, and 204 Hz as well as the 408 Hz harmonic. At point K, three frequencies are observed: 71, 133, and 204 Hz, while at point L these frequencies appear again but with a less pronounced 204 Hz peak. These two points lie in the fully turbulent region downstream of the jet.
From this spectral analysis, it can be concluded that the creation of vortex structures upstream occurs at a frequency of 204 Hz, as indicated by the spectra at points A and B, which show a vortex-passage frequency of 204 Hz. The spectrum at point O demonstrates that these vortices strike the slotted plate 204 times per second. The acoustic spectrum further indicates that their deformation at the slot leads to efficient energy transfer to the acoustic field, generating a self-sustained acoustic feedback loop at 204 Hz. This frequency also excites the shear layer of the downstream jet, causing vortex shedding at 204 Hz in the downstream region. After the impact, 71 vortices per second continue along the upper and lower walls of the plate, while the remaining 133 vortices per second are destroyed as they pass through the slot, generating a disturbance at 133 Hz at the downstream jet exit. The overall spectral analysis shows that the flow intensity at the downstream jet exit also propagates these 71 and 133 Hz disturbances significantly throughout the downstream flow field.
The same analysis was applied to the second flow, with a Reynolds number of Re = 4800. Figure 7 shows the y-velocity spectra at the characteristic points of the flow for Re = 4800. Because of the chaotic behavior of the flow downstream of the plate, the spectrum at point K exhibits a white-noise signature and is therefore not presented for this flow.
Upstream of the slotted plate, the spectra at point A reveal a dominant frequency of 270 Hz, corresponding to the fundamental vortex-generation frequency of the jet. Moving closer to the plate, additional components appear in the spectra of point C, although 270 Hz consistently remains the most energetic. At point O, located just before impact, the spectrum also displays the frequencies 270 and 141 Hz. After interaction with the slot, the spectral content changes significantly. At points E and F, the velocity spectra reveal a strong component at 129 Hz, indicating that part of the incoming vortical structures (129 vortices per second) passes through the wall jet. Simultaneously, vortices passing through the slot generate a distinct component at 141 Hz, associated with their partial breakdown as they cross the opening. Further downstream, the jet shear layer remains predominantly excited at 270 Hz, consistent with the forcing imposed by the upstream feedback loop, while the 129 and 141 Hz disturbances propagate with noticeable amplitude throughout the downstream flow domain. This evolution of the spectral content demonstrates that, at Re = 4800, the upstream forcing at 270 Hz governs the primary vortex shedding and acoustic feedback, while secondary frequencies (129 and 141 Hz) arise from the redistribution and dissipation of vortex structures after impact with the slotted plate.
The main difference between this flow and the previous one is the behavior of the vortex structures propagating along the wall jet. In the Re = 4800 case, these vortices undergo deformation under conditions that are particularly favorable for transferring turbulent kinetic energy into acoustic energy. Unlike the lower-Reynolds-number flow, where the wall-jet vortices rapidly lose coherence and contribute only weakly to sound generation, the 129 Hz structures in the higher-Re jet maintain a sufficiently organized pattern over a longer distance along the plate. Their interaction with the wall and with the local pressure field creates an additional unsteady forcing that can effectively feed the acoustic field. This enhanced energy transfer mechanism gives rise to a secondary aeroacoustics feedback loop, superimposed on the primary loop driven by the 270 Hz vortex formation upstream. The presence of this second loop introduces an additional pathway for coherent energy exchange between the flow and the acoustic field, ultimately generating a supplementary self-sustained tone that appears distinctly in the acoustic spectrum. The emergence of this secondary tone reflects a more complex coupling between vortex dynamics and acoustic radiation, revealing that small variations in flow organization can significantly alter the overall noise signature of the system.
To confirm the aeroacoustics coupling, the cross-correlation function was computed between the acoustic signal and the transverse velocity signal. The result is shown in Figure 8. It can be observed that the cross-correlation function varies periodically, with a maximum correlation value of 0.8. This confirms that the coherent structures passing through this point impact the plate under conditions favorable for the conversion of turbulent energy into acoustic energy, forming a feedback loop at a frequency of 204 Hz, which corresponds to the vortex shedding frequency, as shown in the spectrum of the transverse velocity signal at point A (see Fig. 6). Similar results were obtained for the second Reynolds number, with a lower correlation value (0.6), further confirming the aeroacoustics coupling for both studied flows.
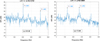 |
Fig. 2 Amplitude spectra of the acoustic signals for the two studied flows: Re = 4700 (left) and Re = 4800 (right). |
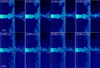 |
Fig. 3 Raw particle images acquired by the cameras at different measurement instants, upstream and downstream of the slotted plate, for the two studied flows at Re = 4700 and Re = 4800. |
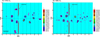 |
Fig. 4 λ2 criterion applied to the instantaneous velocity fields, upstream and downstream of the slotted plate. |
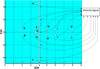 |
Fig. 5 Points of extraction of the velocity signal. |
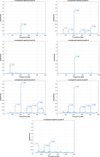 |
Fig. 6 Velocity spectrum at different points of the flow domain, upstream and downstream of the slotted plate, for Re = 4700. |
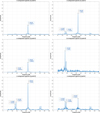 |
Fig. 7 Velocity spectrum at different points of the flow domain, upstream and downstream of the slotted plate, for Re = 4800. |
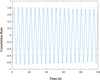 |
Fig. 8 Cross-correlation function between the transverse velocity signal, extracted at point A and the acoustic signal, for Re = 4700. |
4 Discussion
The experimental results presented in this study highlight a strong correlation between the organization of vortical structures and the acoustic response of a jet impinging on a slotted plate. From a fundamental standpoint, this correlation aligns with Howe’s aeroacoustics theory, which describes sound generation as resulting from the interaction between coherent vortical structures and solid surfaces, where energy is transferred from the turbulent flow to the acoustic field through unsteady surface pressure fluctuations.
Spectral analyses performed on both investigated flows reinforce this interpretation by demonstrating that the upstream vortex formation frequency governs the global aeroacoustics behavior of the system. In each case, vortices generated upstream strike the slotted plate at a characteristic frequency (204 Hz at Re = 4700 and 270 Hz at Re = 4800), which sets the dominant tone of the self-sustained feedback loop. Their deformation at the slot provides an efficient pathway for transferring turbulent kinetic energy into acoustic energy, thereby establishing and sustaining the acoustic resonance. Downstream of the plate, the shear layer responds by shedding vortices at the same forcing frequency, while additional secondary disturbances arising from vortices convected along the walls or destroyed at the slot propagate throughout the flow field and shape the overall unsteady dynamics.
At Re = 4700, the jet exhibits a symmetric vortex arrangement associated with a high cross-correlation coefficient (0.8) between the transverse velocity and the acoustic signal. This configuration favors a regular and periodic interaction with the slot, promoting the onset and maintenance of a robust aeroacoustics feedback loop characterized by a dominant tone at 204 Hz. This scenario illustrates the optimal functioning of the energy conversion mechanism described by Howe, where coherent vortical structures maximize the efficiency of sound radiation.
In contrast, at a slightly higher Reynolds number (Re = 4800), a transition to an antisymmetric vortex pattern is observed. This loss of symmetry leads to a notable reduction in sound pressure levels (−8 dB) and a broadening of the acoustic spectrum, where two dominant tones emerge (129 and 270 Hz). The reduced correlation coefficient (0.6) reflects a desynchronization between vortex dynamics and acoustic emission, indicating a lower efficiency in the turbulent-to-acoustic energy transfer process. Furthermore, the vortices convected along the wall jet at 129 Hz undergo deformation conditions favorable to a secondary energy conversion mechanism, generating an additional feedback loop and a secondary self-sustained tone captured in the acoustic spectrum.
Overall, these findings underscore the central role of coherent vortex dynamics in sustaining aeroacoustic feedback and shaping the tonal noise characteristics of impinging jets. They also highlight new practical perspectives for active or passive noise control in ventilation systems. Modulating the organization of coherent structures through adjustments of injection conditions or local modifications of impact-surface geometry emerges as a promising strategy to reduce noise without compromising airflow performance. This approach is particularly relevant in the context of sustainable cities, where acoustic comfort, energy efficiency, and indoor air quality must be addressed in an integrated manner.
In the future, a more detailed evaluation of the energy conversion process could be conducted by analyzing Howe’s integrand for this specific configuration in order to identify the regions and conditions where energy transfer is maximized. The spectral analysis provides a first understanding of the correlation between the two studied flows (upstream and downstream of the plate). However, it is still insufficient to fully capture the underlying phenomena. In this context, and as a perspective for future work, POD and DMD analyses could be valuable for investigating the spatiotemporal relationships between the two jets. Such an approach would contribute to the design of innovative ventilation systems that align with the goals of energy transition and next-generation urban comfort.
Acknowledgments
The authors wish to thank FEDER and the region of Nouvelle Aquitaine, France for its financial support.
Funding
This research was funded by FEDER and the region of Nouvelle Aquitaine.
Conflicts of interest
The authors declare no conflict of interest.
Data availability statement
The data presented in this study are available on request from the corresponding author. The data are not publicly available due to the Laboratory’s privacy policy.
Author contribution statement
Conceptualization, A.S., K.A.-M., and H. A.; methodology, N.E.A. and K.A.-M.; software, N.E.A. and O.L.; writing—original draft preparation, N.E.A. and K.A.-M.; writing—review and editing, N.E.A. and H.A.; project administration, A.S., K.A.-M., and M.E.H.; and funding acquisition, A.S. All authors have read and agreed to the published version of the manuscript.
References
- C.-M. Ho, N.S. Nosseir, Dynamics of an impinging jet. Part 1. The feedback phenomenon, J. Fluid Mech. 105, 119–142 (1981) [Google Scholar]
- M.J. Lighthill, On sound generated aerodynamically II. Turbulence as a source of sound, Proc. R. Soc. Lond. A 222, 1–32 (1954) [Google Scholar]
- A. Powell, On the edgetone, J. Acoust. Soc. Am. 33, 395–409 (1961) [Google Scholar]
- M.S. Howe, Contributions to the theory of aerodynamic sound, with application to excess jet noise and the theory of the flute, J. Fluid Mech. 71, 625–673 (1975) [Google Scholar]
- Y. Zhang, Experimental studies of the turbulence structures of impinging reacting jets using time-resolved particle image velocimetry visualization, hot wire anemometry and acoustic signal processing, Exp. Fluids 29, S282–S290 (2000) [Google Scholar]
- R.C. Chanaud, A. Powell, Some experiments concerning the hole and ring tone, J. Acoust. Soc. Am. 37, 902–911 (1965) [Google Scholar]
- A. Billon, V. Valeau, A. Sakout, Two feedback paths for a jet-slot oscillator, J. Fluids Struct. 21, 121–132 (2005) [Google Scholar]
- H.H. Assoum, M.E. Hassan, K. Abed-Meraïm, R. Martinuzzi, A. Sakout, Experimental analysis of the aero-acoustic coupling in a plane impinging jet on a slotted plate, Fluid Dyn. Res. 45, 045503 (2013) [Google Scholar]
- H.H. Assoum, J. Hamdi, K. Abed-Meraïm, M. El Hassan, M. Ali, A. Sakout, Correlation between the acoustic field and the transverse velocity in a plane impinging jet in the presence of self-sustaining tones, Energy Procedia 139, 391–397 (2017) [Google Scholar]
- H.H. Assoum, J. Hamdi, K. Abed-Meraïm, M. El Hassan, A. Hammoud, A. Sakout, Experimental investigation of the turbulent kinetic energy and the acoustic field in a rectangular jet impinging a slotted plate, Energy Procedia 139, 398–403 (2017) [Google Scholar]
- A. Dhamanekar, K. Srinivasan, Effect of impingement surface roughness on the noise from impinging jets, Phys. Fluids 26, 036101 (2014) [Google Scholar]
- M. Akamine et al., Effect of nozzle–plate distance on acoustic phenomena from supersonic impinging jet, AIAA J. 56, 1943–1952 (2018) [Google Scholar]
- R. Gojon, C. Bogey, Effects of the angle of impact on the aeroacoustic feedback mechanism in supersonic impinging planar jets, Int. J. Aeroacoust. 18, 258–278 (2019) [Google Scholar]
- J. Hamdi, H.H. Assoum, M. Alkheir, K. Abed-Meraïm, S. Cauet, A. Sakout, Analysis of the 3D flow of an impinging jet on a slotted plate using TR-Tomo PIV and Proper Orthogonal Decomposition, Energy Rep. 6, 158–163 (2020) [Google Scholar]
- J. Hamdi, H. Assoum, K. Abed-Meraïm, A. Sakout, Analysis of the effect of the 3C kinematic field of a confined impinging jet on a slotted plate by stereoscopic PIV, Eur. J. Mech. B Fluids 76, 243–258 (2019) [Google Scholar]
- H.H. Assoum et al., Tomographic Particle Image Velocimetry and Dynamic Mode Decomposition (DMD) in a rectangular impinging jet: Vortex dynamics and acoustic generation, Fluids 6, 429 (2021) [Google Scholar]
- H.H. Assoum et al., Turbulent kinetic energy and self-sustaining tones: Experimental study of a rectangular impinging jet using high speed 3D tomographic Particle Image Velocimetry, JMES 14, 6322–6333 (2020) [Google Scholar]
- H.H. Assoum, M. El Hassan, J. Hamdi, M. Alkheir, K.A. Meraim, A. Sakout, Turbulent kinetic energy and self-sustaining tones in an impinging jet using high speed 3D Tomographic-PIV, Energy Rep. 6, 802–806 (2020) [Google Scholar]
- M. Alkheir, T. Mrach, J. Hamdi, K. Abed-Meraim, L. Rambault, M. El Hassan, Effect of passive control cylinder on the acoustic generation of a rectangular impinging jet on a slotted plate, Energy Rep. 6, 549–553 (2020) [Google Scholar]
- N.E. Afyouni et al., Effect of a control mechanism on the interaction between a rectangular jet and a slotted plate: Experimental study of the aeroacoustic field, Fluids 8, 309 (2023) [Google Scholar]
- N. Rajaratnam, Turbulent Jets, Developments in Water Science, vol. 5, Elsevier Scientific Pub. Co., Amsterdam, New York, 1976 [Google Scholar]
- H. Assoum, Étude expérimentale des couplages entre la dynamique d’un jet qui heurte une plaque fendue et l’émission sonore générée, PhD thesis, La Rochelle University, 2013 [Google Scholar]
- FlowMaster Getting Started. LaVision [Google Scholar]
Cite this article as: N.E. Afyouni, K. Abed-Meraim, O. Lakdar, H. Assoum, A. Sakout, M. El Hassan, Quantitative visualization of flows upstream and downstream of an obstacle impinged by a jet using two synchronized S-PIV: application to aeroacoustics, Mechanics & Industry 27, 23 (2026), https://doi.org/10.1051/meca/2026019
All Figures
|
Fig. 1 Schematic representation of the jet facility: (1) frequency chopper, (2) compressor, (3) stabilizing chamber, (4) duct, (5) nozzle, (6) slotted plate, (7) slot (left). Photo of the experimental setup consisting of double SPIV before and behind the slotted plate and two microphones (right). |
| In the text | |
|
Fig. 2 Amplitude spectra of the acoustic signals for the two studied flows: Re = 4700 (left) and Re = 4800 (right). |
| In the text | |
|
Fig. 3 Raw particle images acquired by the cameras at different measurement instants, upstream and downstream of the slotted plate, for the two studied flows at Re = 4700 and Re = 4800. |
| In the text | |
|
Fig. 4 λ2 criterion applied to the instantaneous velocity fields, upstream and downstream of the slotted plate. |
| In the text | |
|
Fig. 5 Points of extraction of the velocity signal. |
| In the text | |
|
Fig. 6 Velocity spectrum at different points of the flow domain, upstream and downstream of the slotted plate, for Re = 4700. |
| In the text | |
|
Fig. 7 Velocity spectrum at different points of the flow domain, upstream and downstream of the slotted plate, for Re = 4800. |
| In the text | |
|
Fig. 8 Cross-correlation function between the transverse velocity signal, extracted at point A and the acoustic signal, for Re = 4700. |
| In the text | |
Current usage metrics show cumulative count of Article Views (full-text article views including HTML views, PDF and ePub downloads, according to the available data) and Abstracts Views on Vision4Press platform.
Data correspond to usage on the plateform after 2015. The current usage metrics is available 48-96 hours after online publication and is updated daily on week days.
Initial download of the metrics may take a while.