Fig. 3
Download original image
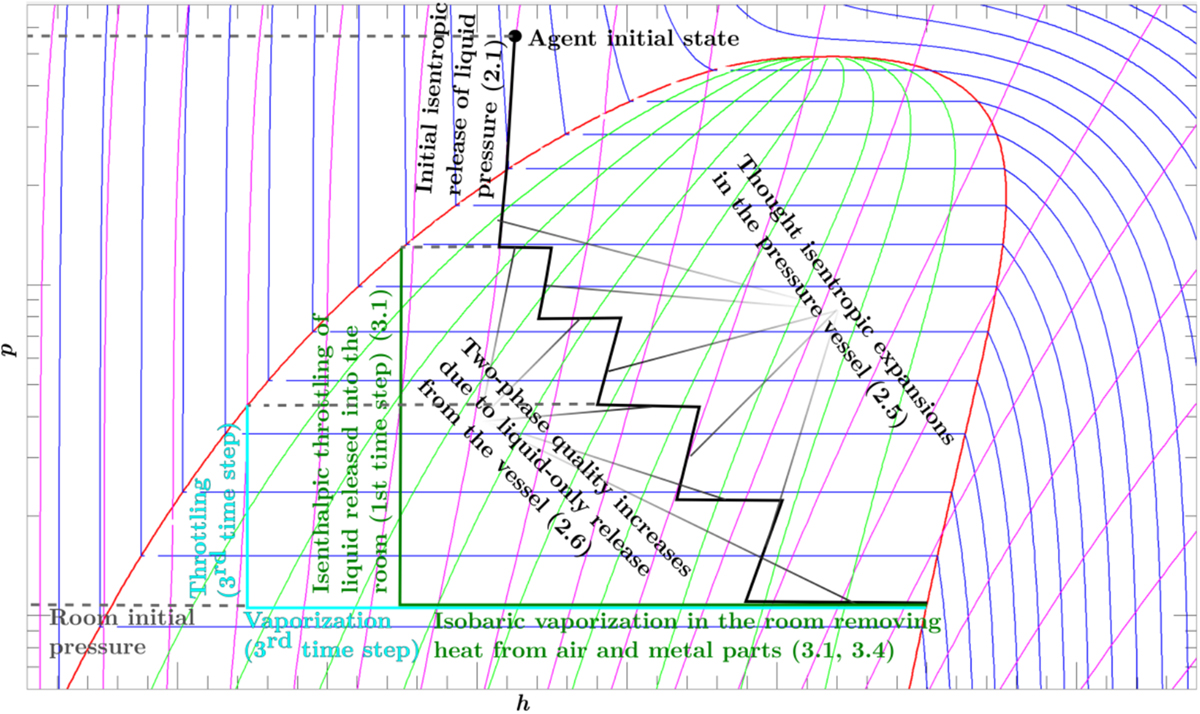
Schematic pressure-enthalpy diagram of the extinguishing agent with annotated examples of phenomena described in (2) and (3). Red − saturation curves; blue − isotherms; magenta − isentropes, green − curves of constant two-phase quality. Other curves annotated in the figure by text of corresponding colour. (Own work based on NIST REFPROP fluid thermophysical database program.)
Current usage metrics show cumulative count of Article Views (full-text article views including HTML views, PDF and ePub downloads, according to the available data) and Abstracts Views on Vision4Press platform.
Data correspond to usage on the plateform after 2015. The current usage metrics is available 48-96 hours after online publication and is updated daily on week days.
Initial download of the metrics may take a while.