Open Access
Fig. 4
Download original image
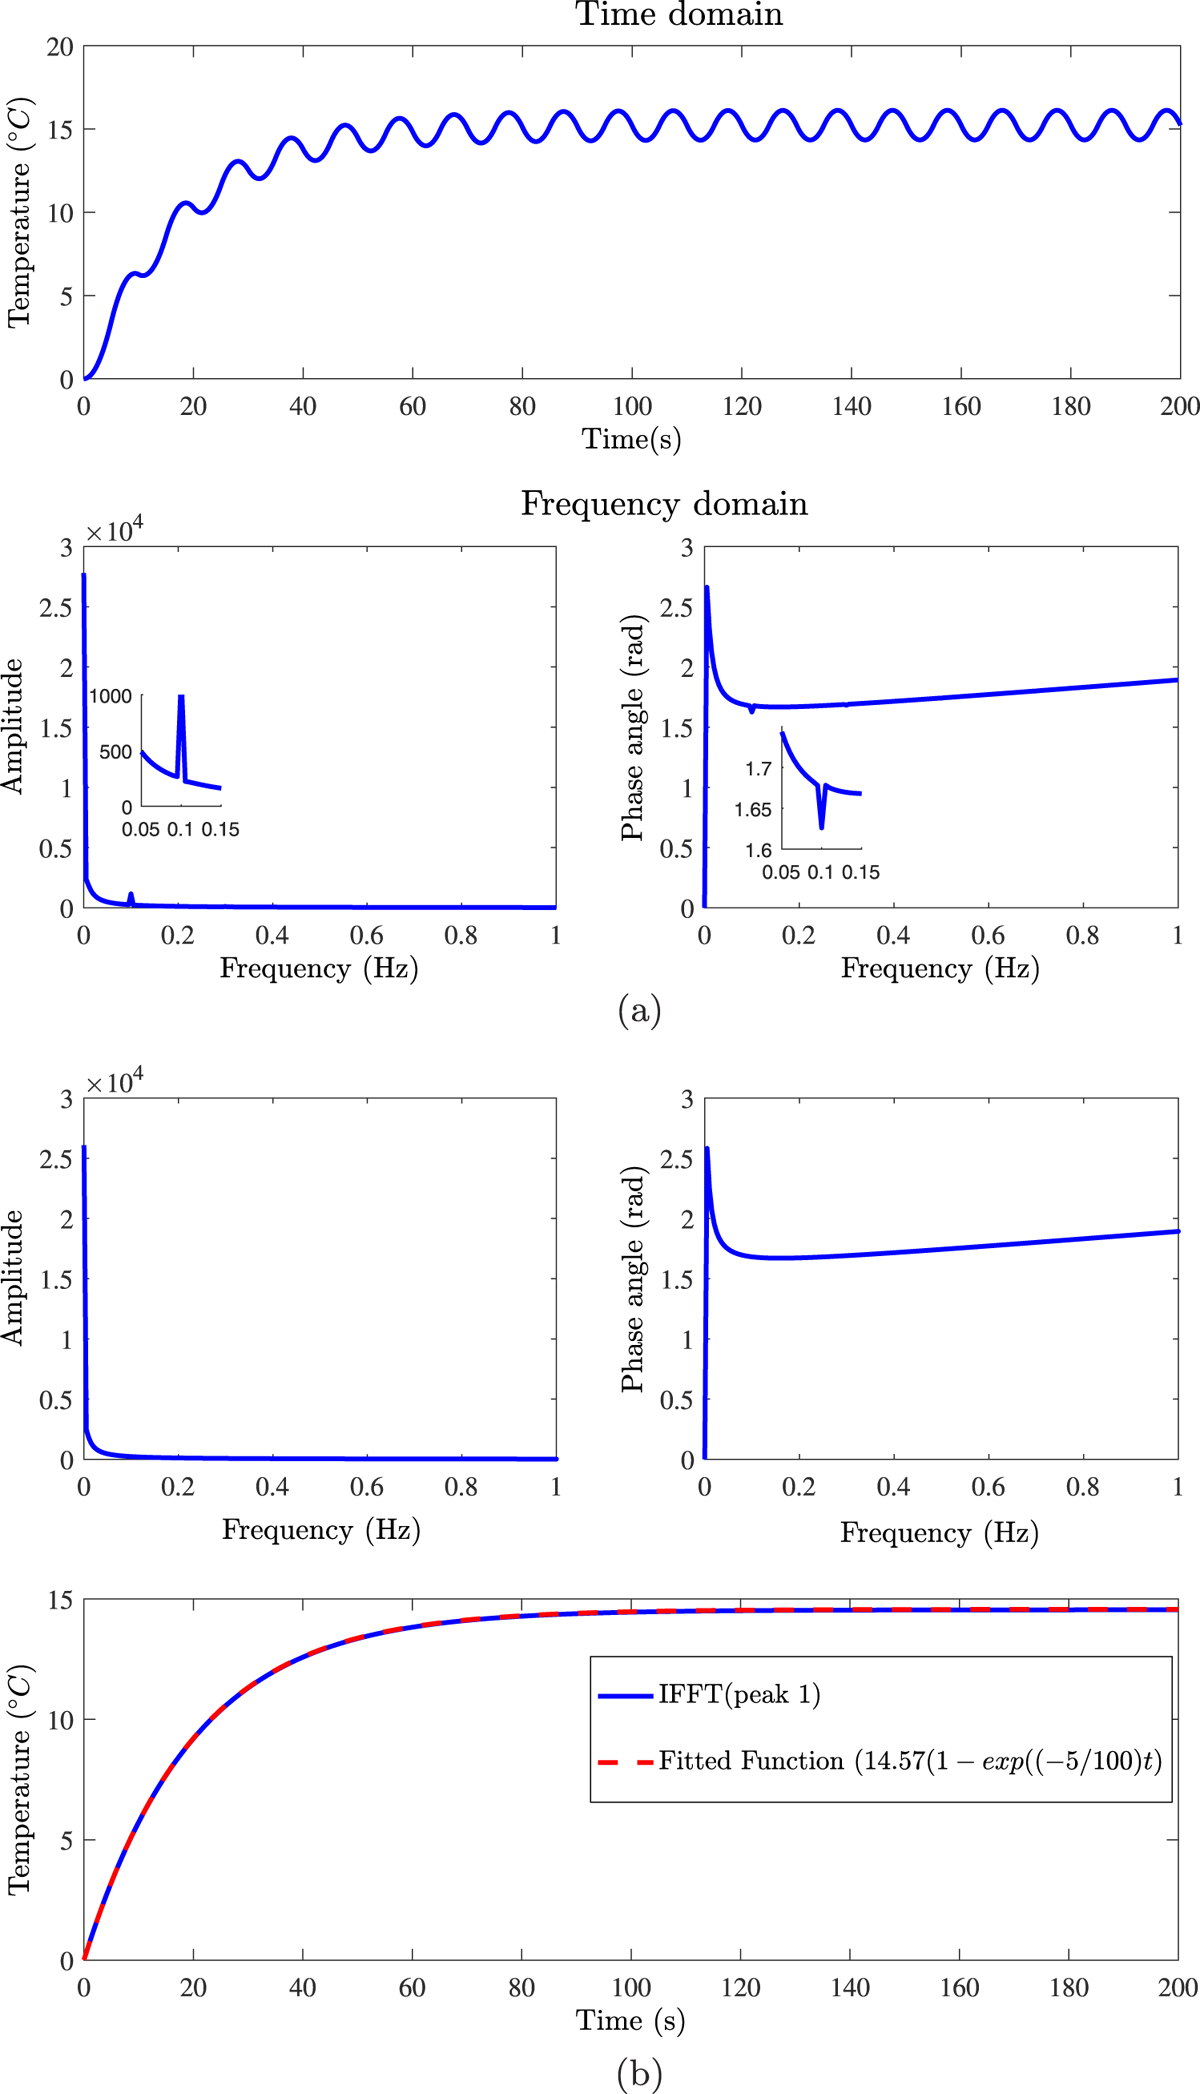
Time basis. (a) The evolution of the temperature in the time and frequency domains at the center point (x, y, z) = (25, 25, 25) and a zoom on the second peak. (b) Generation of the time basis for the first peak.
Current usage metrics show cumulative count of Article Views (full-text article views including HTML views, PDF and ePub downloads, according to the available data) and Abstracts Views on Vision4Press platform.
Data correspond to usage on the plateform after 2015. The current usage metrics is available 48-96 hours after online publication and is updated daily on week days.
Initial download of the metrics may take a while.