Fig. 3
Download original image
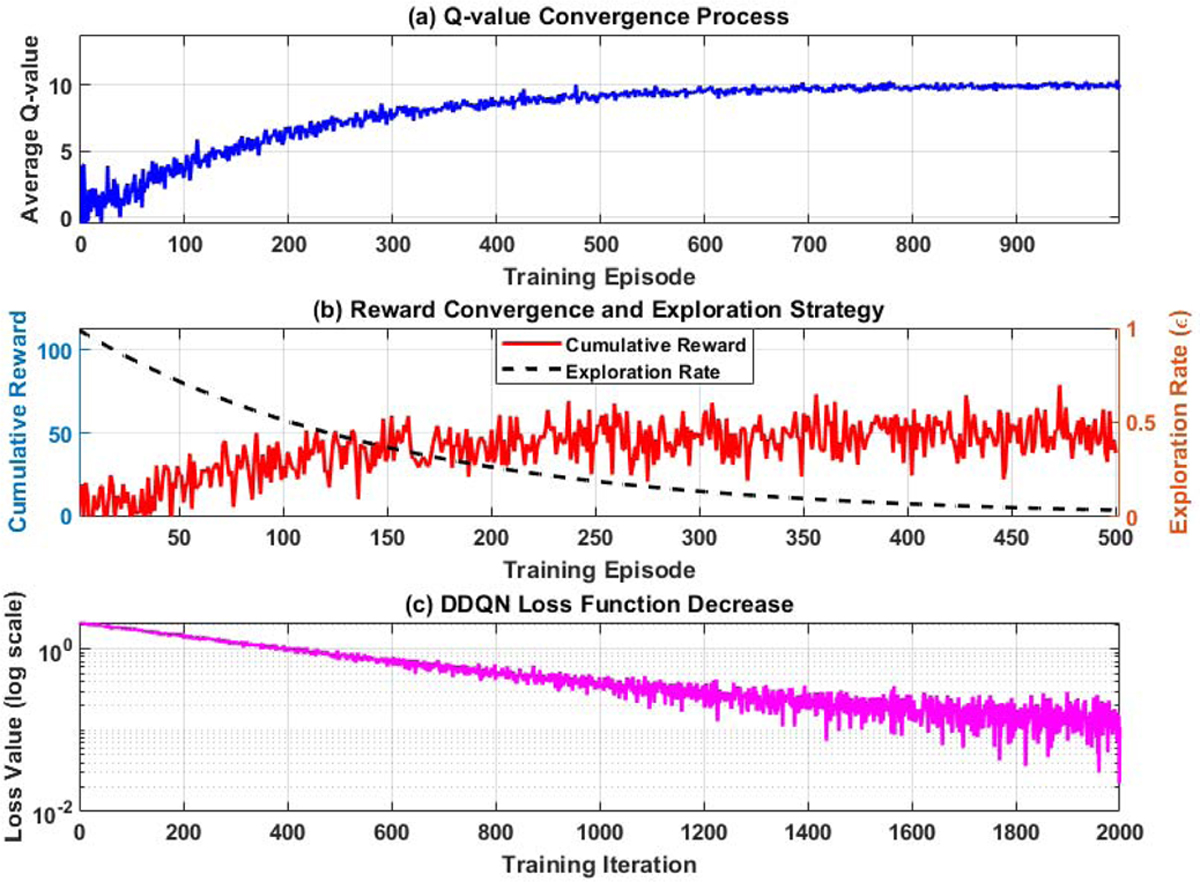
Schematic diagram of the training process of the reinforcement learning intelligent decision engine. (a) Q-value convergence process. (b) Reward convergence and exploration strategy. (c) DDQN loss function downward trend.
Current usage metrics show cumulative count of Article Views (full-text article views including HTML views, PDF and ePub downloads, according to the available data) and Abstracts Views on Vision4Press platform.
Data correspond to usage on the plateform after 2015. The current usage metrics is available 48-96 hours after online publication and is updated daily on week days.
Initial download of the metrics may take a while.