Fig. 16
Download original image
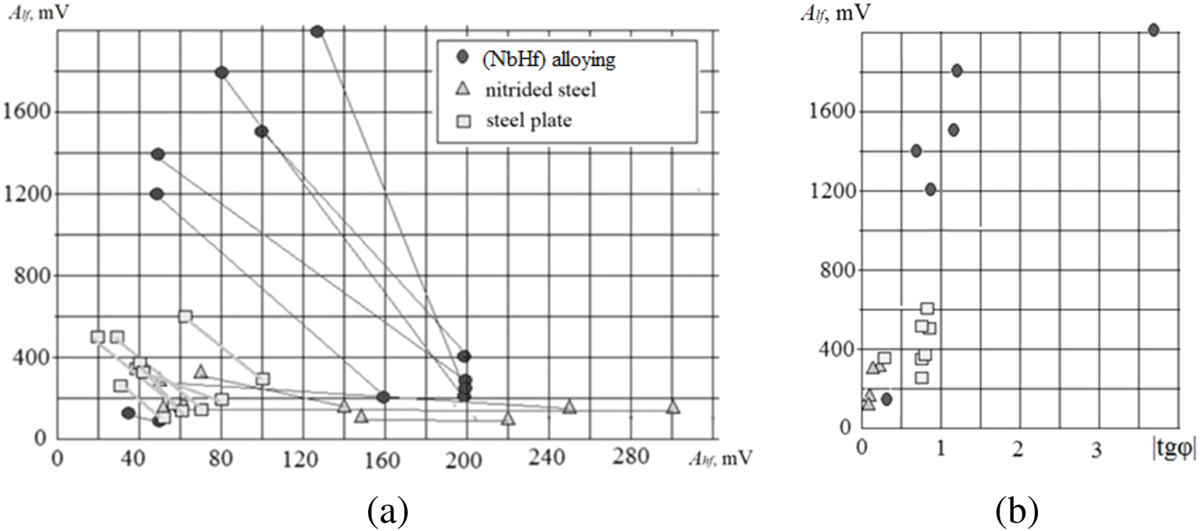
Graphic representation of changes in the surface treatment of steel using LEHCEB according to the analysis of vibroacoustic vibrations: (a) the vector image of the results; (b) the presentation of results in the coordinates (A lf, tgφ) (A lf − low-frequency component, A hf – high-frequency component, φ − the angle of vector inclination (Fig. 15)).
Current usage metrics show cumulative count of Article Views (full-text article views including HTML views, PDF and ePub downloads, according to the available data) and Abstracts Views on Vision4Press platform.
Data correspond to usage on the plateform after 2015. The current usage metrics is available 48-96 hours after online publication and is updated daily on week days.
Initial download of the metrics may take a while.