Fig. 3
Download original image
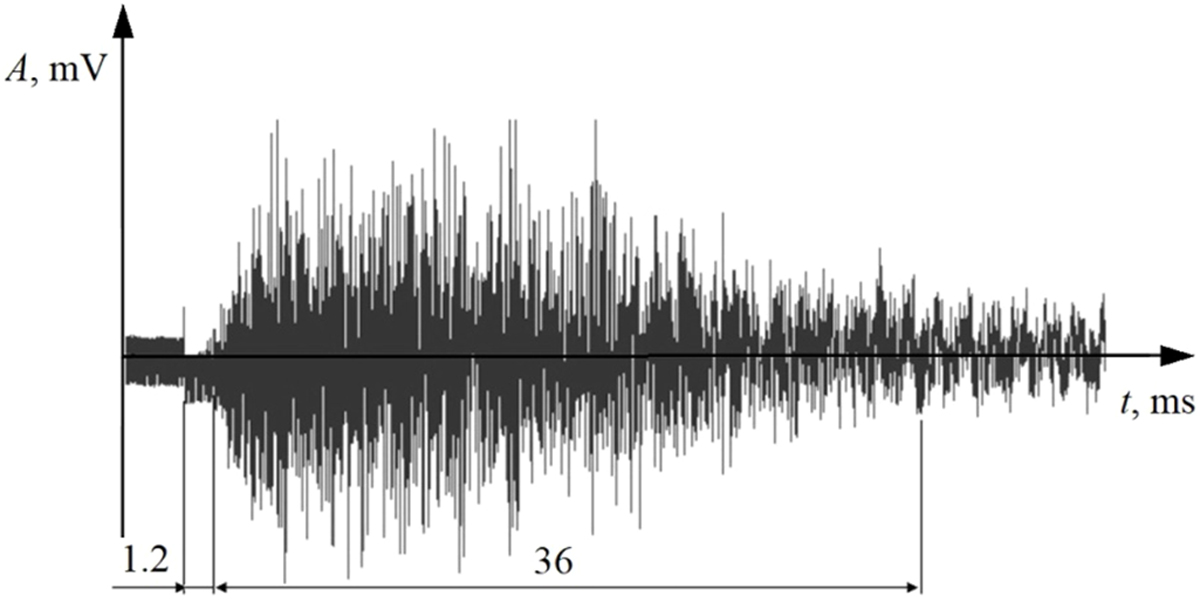
An example of recording a vibroacoustic signal after the pulse: 1.2 ms − the time from the moment of the occurrence of electromagnetic interference to the beginning of the signal recording; 36 ms − the time of the presence of the main energy of the vibration signal.
Current usage metrics show cumulative count of Article Views (full-text article views including HTML views, PDF and ePub downloads, according to the available data) and Abstracts Views on Vision4Press platform.
Data correspond to usage on the plateform after 2015. The current usage metrics is available 48-96 hours after online publication and is updated daily on week days.
Initial download of the metrics may take a while.