| Issue |
Mechanics & Industry
Volume 21, Number 6, 2020
|
|
|---|---|---|
| Article Number | 622 | |
| Number of page(s) | 9 | |
| DOI | https://doi.org/10.1051/meca/2020096 | |
| Published online | 06 January 2021 | |
Regular Article
A Thermo-hydrodynamic lubrication model of a mechanical seal modified by equivalent film thickness
1
School of Mechanical Engineering, Jiangsu University of Technology, Changzhou 213000, PR China
2
School of Computer Engineering, Jiangsu University of Technology, Changzhou 213000, PR China
* e-mail: wangxy621@163.com
Received:
1
August
2020
Accepted:
6
December
2020
An effective way to improve the combined performance of mechanical seals is to optimize their surface textures using multi-objective optimization method. For compatibility with the multi-objective optimization algorithm, the theoretical performance of a mechanical seal is often determined using the finite-difference method (FDM). However, compared with the finite-volume method (FVM) and finite-element method (FEM), FDM is weaker for dealing with the issue of discontinuous film thickness for a textured surface. In the present study, the thermo-hydrodynamic lubrication model of a mechanical seal is modified by means of an equivalent-thickness treatment, and the accuracy of the modified lubrication model is assessed by comparing its predictions for film pressure and temperature with published FVM and FEM results, showing that the equivalent-thickness lubrication model is effective for addressing the issue of discontinuous film thickness. The present work is important in that it improves the simulation accuracy of multi-objective optimization for textured mechanical seals.
Key words: Mechanical seal / multi-objective optimization / surface texture / discontinuous film thickness / equivalent thickness
© AFM, EDP Sciences 2021
1 Introduction
In rotating machinery, leaks are prevented using mechanical seals, which have been subjected to much work to reduce friction and wear as well as leaks. In tribology, a popular method for reducing friction and wear is surface texturing [1–5], which has also received extensive attention in the context of mechanical seals. However, a surface texture with low friction or high opening force often results in a high rate of leakage [3–5], which is due to the produced opening force increasing the clearance available to the mechanical seal rings, thereby increasing the leakage [5]. Siripuram and Stephens [4] found that, for positive asperity, maximum leakage to occur at an asperity area fraction of 0.2, at which the friction coefficient is minimum; for negative asperity, the leakage tends to increase with decreasing friction coefficient.
To address this contradiction between friction and leakage, Wang et al. [3,6] used multi-objective optimization to obtain an optimal texture based on an asymmetric “V” shape that differed from the optimal shape obtained using single-objective optimization [7,8]. That work inspired the texture optimization of mechanical components with more than one important performance parameter, but the multi-objective optimization research on surface textures that has been reported to date has solved for the performance parameters using greatly simplified control equations, such as by ignoring thermal and film-discontinuity effects, thereby producing inevitably less-accurate optimization results.
Thermal effects are important when simulating a textured mechanical seal using a lubrication model [9–14]. Work based on a simplified energy equation under adiabatic conditions and with a constant temperature across the thickness of the film showed that the viscosity-thermal effect is important for slider and stepped bearing [13,14]. Khonsari [15,16] summarized early works on thermal effects in journal bearings and noted that most of the existing analytical solutions are based on simplified assumptions with questionable validity. A recent review by Sivakumar et al. [17] concluded that the thermal effects have a strong influence on the film thickness and pressure, and that thermal behavior is affected greatly by speed. It has also been noted that a temperature difference across the film, known as the “viscosity wedge” effect, has a significant effect on the load-carrying capacity [18,19]. The above analysis suggests that considering viscosity-thermal effect may lead to more-accurate multi-objective optimization of surface textures on mechanical seals.
For lubrication models involving a textured surface, the problem of film thickness discontinuity often occurs. Figure 1 shows a typical case in which a dimpled surface divides the fluid film into two regions, namely A and B, the film thickness discontinuity occurs at the boundary between regions A and B. The finite-volume method (FVM) and finite-element method (FEM) are powerful tools for addressing this issue [20–23]. For instance, Miller and Green [22,23] used the FVM and FEM successfully to deal with the film thickness discontinuity in spiral-grooved face seals. Although finite-difference method (FDM) is weaker to deal with the film thickness discontinuity, it can also address this issue if the region of film thickness discontinuous is subjected to special treatment. For instance, Chen et al. [24] used an eight-point discrete grid to approximate the gradient of film thickness, and Ogata et al. [25] provided an algorithm by defining equivalent clearance height and its gradient in the region of discontinuous film thickness in a two-dimensional step bearing. However, for the multi-objective optimization of textured mechanical seals, the FVM and FEM are not easy readily compatible with the multi-objective optimization algorithm. Instead, the lubrication model in references [3] and [6] must be modified to improve the FDM calculation accuracy.
Herein, a three-dimensional lubrication model is presented that considers film thickness discontinuity and thermal effects. Inspired by reference [25], the film thickness discontinuity is treated by defining and equivalent film thickness and its gradient. The lubrication model considers heat dissipation by convection. The modified lubrication model is then used to calculate the distributions of pressure and temperature, and its accuracy is assessed by comparison with published results. The present work is important in that it will improve the simulation accuracy in future multi-objective optimizations of textured mechanical seals.
 |
Fig. 1 Model of lubrication with textured surface. |
2 Thermo-hydrodynamic lubrication model
2.1 Reynolds equation
Figure 2 shows a model of a textured mechanical seal. By selecting a periodic texture area, the computational domain is simplified to a rectangular one. The pressure distribution in the fluid film is obtained by solving the Reynolds equation in the form (1)while the effect of temperature on viscosity is considered using the Barus equation in the form
 (2)
(2)
By the dimensionless criterion, equations (1) and (2) are expressed in dimensionless form respectively as (3)
(3)
 (4)
(4)
The dimensionless Reynolds equation (3) is written as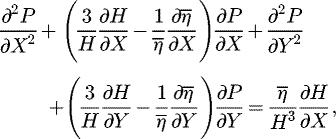 (5)
(5)
where  . Here, u is the velocity, η is the dynamic viscosity of lubrication, η
0 is the viscosity at the temperature t
0, β is the viscosity-thermal coefficient, and h
0 is the minimum thickness of lubrication film. The calculation domain is a square with side length a, the inner and outer boundary pressures are p
inner and p
outer, and periodic boundaries are applied to account for the interaction between textures. In the cavitation regions, the pressure is set to zero according to Reynolds cavitation condition. In the region of continuous film thickness, the dimensionless Reynolds equation is discretized using a central differential in the form of
 (6)from which the differencing equation of Pi,j
is obtained as
 |
Fig. 2 Model of textured mechanical seal. |
2.2 Equivalent thickness model
The film thickness is discontinuous where the textured and non-textured regions meet. This issue is addressed using a two-dimensional equivalent thickness model inspired by the one-dimensional equivalent clearance model in reference [25]. In the x and y directions, the respective flow equations are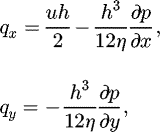 (8)
(8)
which in dimensionless form are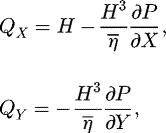 (9)
(9)
where  . Suppose that node (i, j) is a point of discontinuous film thickness. The continuity equations of fluid are
 (10)
(10)
and equation (9) is discretized by an upwind and downwind differential scheme at the region of discontinuous film thickness, namely (11)
(11)
Then, according to equations (10) and (11), the differencing equation for Pi,j
is obtained as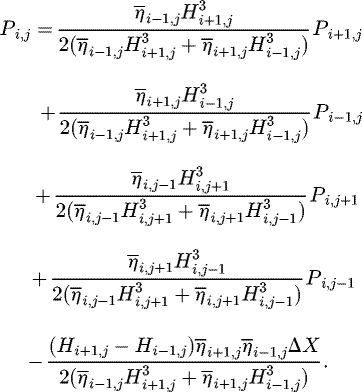 (12)
(12)
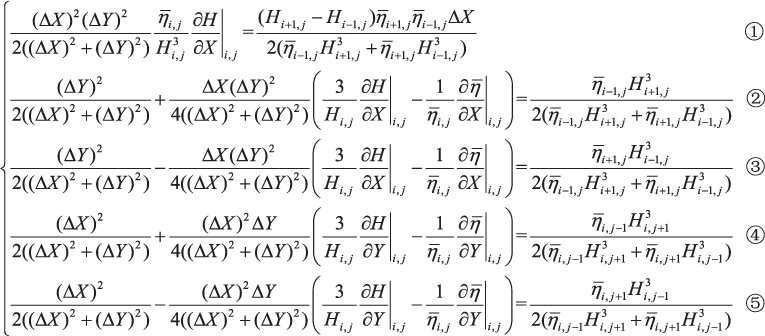
Comparing equations (7) and (12) shows that the expressions for Pi , j are different for the continuous and discontinuous regions. The equivalent thickness and its gradient are obtained by solving
which were obtained by defining the constant term and the corresponding coefficients of Pi +1, j , Pi −1, j , Pi , j +1 and Pi , j −1 be equal in equations (7) and (12), respectively. The new equation
were obtained by subtracting equation (13-1) and equation (13-3), equation (13-4) and equation (13-5), respectively. Equation (15-1) was obtained by dividing equation (14-2) by equation (14-1), while equation (15-2) and (15-3) were obtained by substituting equation (15-1) into equation (14-2) and equation (14-3), respectively:
By using equation (15) to redefine Hi , j , (∂H/∂X)| i , j and (∂H/∂Y)| i , j in the discontinuous regions, equation (7) becomes true for the entire calculation domain including continuous and discontinuous regions. This then allows the Reynolds equation to be solved using the FDM.
2.3 Energy equation
For hydrodynamic lubrication state, it is regarded as an adiabatic process in order to simplify the procedures in this study. In fact, the viscous heat generated in the fluid is dissipated through the fluid film, into the nearby solids. The entire field of thermo-elasto-hydrodynamic lubrication deals with this phenomenon. More details can be seen in the work by Srivastava et al. [11]. The temperature, pressure and viscosity are assumed to remain constant in the film thickness direction, then a simplified energy equation is obtained in the form (16)where qx
and qy
are the volume flows in the x and y directions, respectively, ρ is the fluid density, and cρ
is the specific heat of lubricant. The dimensionless energy equation is
 (17)where
  .
.
To assess the accuracy of the equivalent film thickness model and the program calculation in the present study, the dimensionless load-carrying capacity W, the dimensionless pressure P, the dimensionless temperature T are obtained as performance parameters by using FDM to solve the above equations. The dimensionless load-carrying capacity W is defined as the integral of the dimensionless pressure P in the dimensionless calculation domain, namely (18)
(18)
The performance parameters were calculated using the procedure shown in Figure 3. The number of nodes was 1000 × 1000 for the lubrication model
 |
Fig. 3 Flowchart of procedure. |
3 Accuracy assessment
3.1 Inclined surface model
For an inclined surface as shown in Figure 4, the film thickness is continuous and does not require special treatment using equation (15). To assess the accuracy of the lubrication model for continuous film thickness, its calculated values are compared with the results obtained by Raimondi [13].
In the present study, the parameter values that are used for the lubricating oil are the same as those in reference [13], namely t
0 = 100 °F, η
0 = 8.16 × 10⁻⁶ lb s/in.2, ρ = 0.0312 lb/in.3, cv
= c
ρ
= 4435 in./°F, where the parameter values are given in non-standard units for consistency with the quoted reference. The viscosity η = η
0e−
β(
t−t
0
)
is applied, and β = 0.02342 is obtained by curve fitting using the values of viscosity and temperature given in Table 1 in reference [13] (the tables and figures in the references are quoted in all capitals in order to distinguish them from this paper, the same below). The density is treated as being constant of 0.0312 lb/in.3 because it changes little within the temperature range used in reference [13]. The film thickness h and the dimensionless film thickness H are expressed as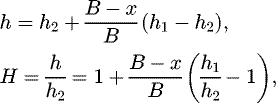 (19)
(19)
and two parameters used in reference [13] are defined as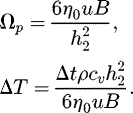 (20)
(20)
With the above parameter values, equations (1) and (16) are solved using the FDM for B/L = 1, with ΔT and p
max
BL/W (i.e. p
max/P in Ref. [13]) calculated under various working conditions. The results calculated by Raimondi are taken directly from Table 2 in reference [13]. Herein, Table 1 gives the results obtained by the present approach and Raimondi, from which the errors in ΔT and p
max
BL/W are calculated using (21)
(21)
Figure 5 compares the present and published results for 10−4Ωp = 10 psi. As can be seen, within the range of parameter values studied, the maximum error in ΔT (7.3%) occurs at h 1/h 2 = 4.0 and the maximum error in p max BL/W (3.3%) occurs at h 1/h 2 = 1.4. Meanwhile, the manner in which the errors vary with h 1/h 2 shows no obvious trend and instead can be considered as random. In general, the errors between the present method and that in reference [13] are very small in most cases.
Figure 6 compares the present and published results for h 1/h 2 = 2. As can be seen, within the range of parameter values studied, the maximum error in ΔT (7.7%) occurs at 10−4Ωp = 10 psi and the maximum error in p max BL/W (4.3%) occurs at 10−4Ωp = 30 psi. Meanwhile, the manner in which the errors vary with 10−4Ωp shows no obvious trend and instead can be considered as random. Combining the errors in Figures 5 and 6 the maximum error is only 7.7% within the range of parameter values studied. The two approaches give different results under the same conditions for the following main reasons. (1) The results differ slightly according to the meshing conditions. (2) The value β = 0.02342 is obtained by curve fitting using the values of viscosity and temperature in Table 1 in reference [13], the coefficient of determination of the curve fitting is 0.996, which is close to but not equal to 1. Therefore, the viscosity values used in the present study differ slightly from those in reference [13]. (3) The Density is treated herein as a constant, which is slightly different from the treatment in reference [13].
Based on the above analysis, the results calculated in the present study can be considered to agree well with those in reference [13]. This means that the modified lubrication method in the present study can be used to solve the inclined surface model with high precision.
 |
Fig. 4 Model of inclined surface. |
 |
Fig. 5 Comparison of present and published results for 10−4Ωp = 10 psi: (a) ΔT versus h 1/h 2 (b) p max BL/W versus h 1/h 2. |
 |
Fig. 6 Comparison of present and published results for h 1/h 2 = 2: (a) ΔT versus 10−4 (b) p max BL/W versus 10−4 Ω p . |
3.2 Stepped surface model
For a stepped surface, take as an example a pocket bearing as studied by Dobrica and Fillon [21]. Figure 7 shows the physical model, for which the relevant parameter values are the same as those in reference [21], namely L = 0.08 m, B = 0.08 m, hP = hI = 20 µm, ρ = 860 kg/m3, Cρ = 2000 J/kg · K. The viscosity-thermal coefficient β = 0.0316 is calculated from the viscosity values at 40 and 100 °C in reference [21]. The length LP and the width BP of the pocket are varied between 12% and 87% of the entire pad length L and width B, respectively. Based on these parameter values, the pressure distribution, maximum temperature and load capacity are obtained using the present procedure and then compared with those obtained using the FVM in reference [21].
The maximum load capacity is obtained for LP = 66%L, BP = 80%B. Figure 8 shows the pressure distributions obtained using the present FDM and the FVM in reference [21]. As can be seen, the pressure distributions are very close and have similar distributions and close peaks. This means that the FDM modified by the equivalent thickness model is adept at dealing with the discontinuous film thickness.
The maximum temperature T max and the load capacity vary with the pocket size. Two groups of value are obtained from Figure 6 and Figure 7 in reference [21] for LP = 66%L, BP = 80%B and LP = 30%L, BP = 30%B, whereupon the maximum temperature T max and the load capacity are calculated using the present procedure under the same conditions. Table 2 gives the values obtained by Dobrica and Fillon [21] and the present approach.
Figure 9 compares the present and published results for the stepped surface. As can be seen, the errors in T max are higher than those in the load capacity. In the present model, T max is the maximum temperature of the fluid, whereas in reference [21], T max is the maximum temperature of the whole model including the pad, slider and fluid. Figure 11 and Figure 12 in reference [21] show that the temperature of the fluid is slightly lower than those of the pad and slider, in view of which the present results are reasonable. Meanwhile, the maximum error is only 8.88% for the stepped surface model. Overall, the modified lubrication method in the present study can be considered to solve the stepped surface model with high precision compared with the FVM.
By comparison with published results, the modified lubrication model in the present study exhibits high calculation accuracy on both inclined and stepped surfaces. This effectively improves the accuracy of lubrication calculations using the FDM by ensuring the flow continuous for textured surface. The present study provides a necessary theoretical basis for combining the modified FDM with the multi-objective optimization of textured mechanical seals in future research.
 |
Fig. 7 Model of stepped surface. |
 |
Fig. 9 Comparison of present and published results for steppet surface: (a) T max (b) Load_capacity. |
4 Conclusion
This study has provided an equivalent thickness treatment to modify the existing thermo-hydrodynamic lubrication model. The accuracy of the modified lubrication model was assessed by comparing the film pressure distribution, temperature and load capacity calculated using the FDM and published results obtained using the FVM and FEM for models of inclined and stepped surfaces. Upon comparison, the results agreed very well, meaning that the lubrication model modified by the equivalent thickness treatment addresses well the issue of discontinuous film thickness when the FDM is applied. This work is important in that it improves the simulation accuracy of multi-objective optimization of textured mechanical seals.
Acknowledgments
This work was supported by the Talent Introduction Foundation of Jiangsu University of Technology (No. KYY19001) and the Natural Science Foundation of the Jiangsu Higher Education Institutions of China (No. 19KJB460001).
References
- N. Brunetière, B. Tournerie, Numerical analysis of a surface-textured mechanical seal operating in mixed lubrication regime, Tribology International 49, 80–89 (2012) [Google Scholar]
- C.B. Khatri, S.C. Sharma, Performance of two-lobe hole-entry hybrid journal bearing system under the combined influence of textured surface and couple stress lubricant, Mechanics & Industry 18, 603 (2017) [CrossRef] [EDP Sciences] [Google Scholar]
- X. Wang, L. Shi, W. Huang, X. Wang, A multi-objective optimization approach on spiral grooves for gas mechanical seals, Journal of Tribology 140, 041701-1-10 (2018) [Google Scholar]
- R.B. Siripuram, L.S. Stephens, Effect of deterministic asperity geometry on hydrodynamic lubrication, Journal of Tribology 126, 527–534 (2004) [Google Scholar]
- J. Sun, C. Ma, Q. Yu, J. Lu, M. Zhou, P. Zhou, Numerical analysis on a new pump-out hydrodynamic mechanical seal, Tribology International 106, 62–70 (2017) [Google Scholar]
- X. Wang, L. Shi, Q. Dai, W. Huang, X. Wang, Multi-objective optimization on dimple shapes for gas face seals, Tribology International 123, 216–223 (2018) [Google Scholar]
- C. Shen, M. Khonsari, Texture shape optimization for seal-like parallel surfaces: theory and experiment, Tribology Transactions 59, 698–706 (2016) [CrossRef] [Google Scholar]
- H. Zhang, M. Hua, G. Dong, D. Zhang, W. Chen, G. Dong, Optimization of texture shape based on genetic algorithm under unidirectional sliding, Tribology International 115, 222–232 (2017) [Google Scholar]
- S. Blasiak, The two dimensional thermohydrodynamic analysis of a lubrication in non-contacting face seals, Journal of Thermal Science and Technology 10, 1–8 (2015) [CrossRef] [Google Scholar]
- E. Galenne, I. Pierre-Danos, Thermo-elasto-hydro-dynamic modeling of hydrostatic seals in reactor coolant pumps, Tribology Transactions 50, 466–476 (2007) [CrossRef] [Google Scholar]
- G. Srivastava, P. Chiappa, J. Shelton, C. Fred Higgs III, A Thermo-elasto-hydrodynamic lubrication modeling approach to the operation of reactor coolant pump seals. Tribology International 138, 487–498 (2019) [Google Scholar]
- N. Brunetière, B. Tournerie, J. Frěne, A simple and easy-to-use TEHD model for non-contacting liquid face seals, Tribology Transactions 46, 187–192 (2003) [CrossRef] [Google Scholar]
- A.A. Raimondi, An adiabatic solution for the finite slider bearing (L/B = 1), ASLE Transactions 9, 283–298 (1966) [CrossRef] [Google Scholar]
- M. He, P. Allaire, C.H. Cloud, J. Nicholas, A pressure dam bearing analysis with adiabatic thermal effects, Tribology Transactions 47, 70–76 (2004) [CrossRef] [Google Scholar]
- M. Khonsari, A review of thermal effects in hydrodynamic bearings part I: slider and thrust bearings, ASLE Transactions 30, 19–25 (1987) [CrossRef] [Google Scholar]
- M. Khonsari, A review of thermal effects in hydrodynamic bearings. Part II: Journal Bearings, ASLE Transactions 30, 26–33 (1987) [CrossRef] [Google Scholar]
- D. Sivakumar, S. Nagesh, K.N. Seetharamu, Review of thermal, turbulent and misalignment effects on hydrodynamic, Journal Bearings 5, 303–308 (2019) [Google Scholar]
- X. Meng, M. Khonsari, Viscosity wedge effect of dimpled surfaces considering cavitation effect, Tribology International 122, 58–66 (2018) [Google Scholar]
- J. Cui, M. Kanet, P. Yang, P. Yang, The relation between thermal wedge and thermal boundary conditions for the load-carrying capacity of a rectangular pad and a slider with parallel gaps, Journal of Tribology 138, 024502-1-6 (2015) [Google Scholar]
- M.B. Dobrica, M. Fillon, Reynolds' model suitability in simulating rayleigh step bearing thermohydrodynamic problems, Tribology Transactions 48, 522–530 (2005) [CrossRef] [Google Scholar]
- M.B. Dobrica, M. Fillon, Thermohydrodynamic behavior of a slider pocket bearing, Journal of Tribology 128, 312–318 (2006) [Google Scholar]
- B.A. Miller, I. Green, Numerical formulation for the dynamic analysis of spiral-grooved gas face seals, Journal of Tribology 123, 395–403 (2001) [Google Scholar]
- B.A. Miller, I. Green, Numerical techniques for computing rotordynamic properties of mechanical gas face seals, Journal of Tribology 124, 755–761 (2002) [Google Scholar]
- S. Chen, H. Chou, Y. Kang, Stability analysis of hydrodynamic bearing with herringbone grooved sleeve, Tribology International 55, 15–28 (2012) [Google Scholar]
- H. Ogata, J. Sugimura, Equivalent clearance model for solving thermohydrodynamic lubrication of slider bearings with steps, Journal of Tribology 139, 034503-1-5 (2016) [Google Scholar]
Cite this article as: X. Wang, D. Zhi, C. Yu, Y. Chen, A Thermo-hydrodynamic lubrication model of a mechanical seal modified by equivalent film thickness, Mechanics & Industry 21, 622 (2020)
All Tables
All Figures
 |
Fig. 1 Model of lubrication with textured surface. |
| In the text | |
 |
Fig. 2 Model of textured mechanical seal. |
| In the text | |
 |
Fig. 3 Flowchart of procedure. |
| In the text | |
 |
Fig. 4 Model of inclined surface. |
| In the text | |
 |
Fig. 5 Comparison of present and published results for 10−4Ωp = 10 psi: (a) ΔT versus h 1/h 2 (b) p max BL/W versus h 1/h 2. |
| In the text | |
 |
Fig. 6 Comparison of present and published results for h 1/h 2 = 2: (a) ΔT versus 10−4 (b) p max BL/W versus 10−4 Ω p . |
| In the text | |
 |
Fig. 7 Model of stepped surface. |
| In the text | |
 |
Fig. 8 Pressure distributions obtained using (a) FDM and (b) FVM [21]. |
| In the text | |
 |
Fig. 9 Comparison of present and published results for steppet surface: (a) T max (b) Load_capacity. |
| In the text | |
Current usage metrics show cumulative count of Article Views (full-text article views including HTML views, PDF and ePub downloads, according to the available data) and Abstracts Views on Vision4Press platform.
Data correspond to usage on the plateform after 2015. The current usage metrics is available 48-96 hours after online publication and is updated daily on week days.
Initial download of the metrics may take a while.


