Open Access
Fig. 6
Download original image
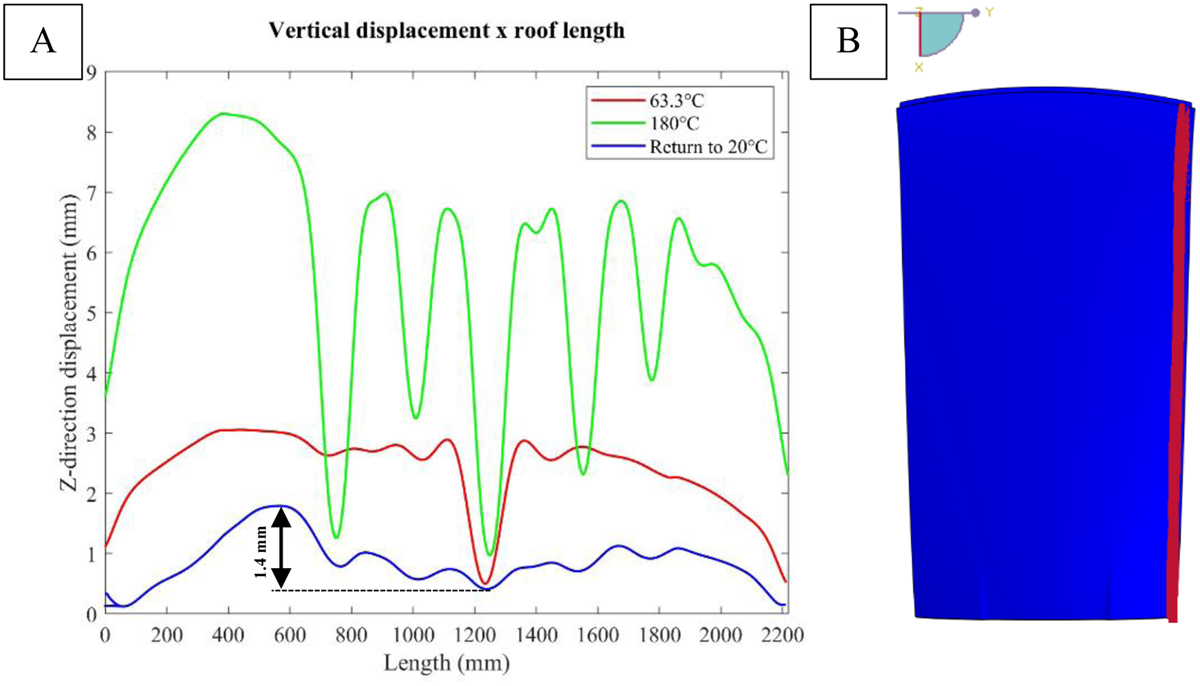
(A) Evolution of out-of-plane displacement derived from the results of post-buckling simulations along the red line highlighted in 6-B at 63.3 °C, 180.0 °C and upon return to 20 °C. (B) Line at a distance of 53 mm from the right edge of the roof (epicenter of the most significant out-of-plane displacements).
Current usage metrics show cumulative count of Article Views (full-text article views including HTML views, PDF and ePub downloads, according to the available data) and Abstracts Views on Vision4Press platform.
Data correspond to usage on the plateform after 2015. The current usage metrics is available 48-96 hours after online publication and is updated daily on week days.
Initial download of the metrics may take a while.