Fig. 8
Download original image
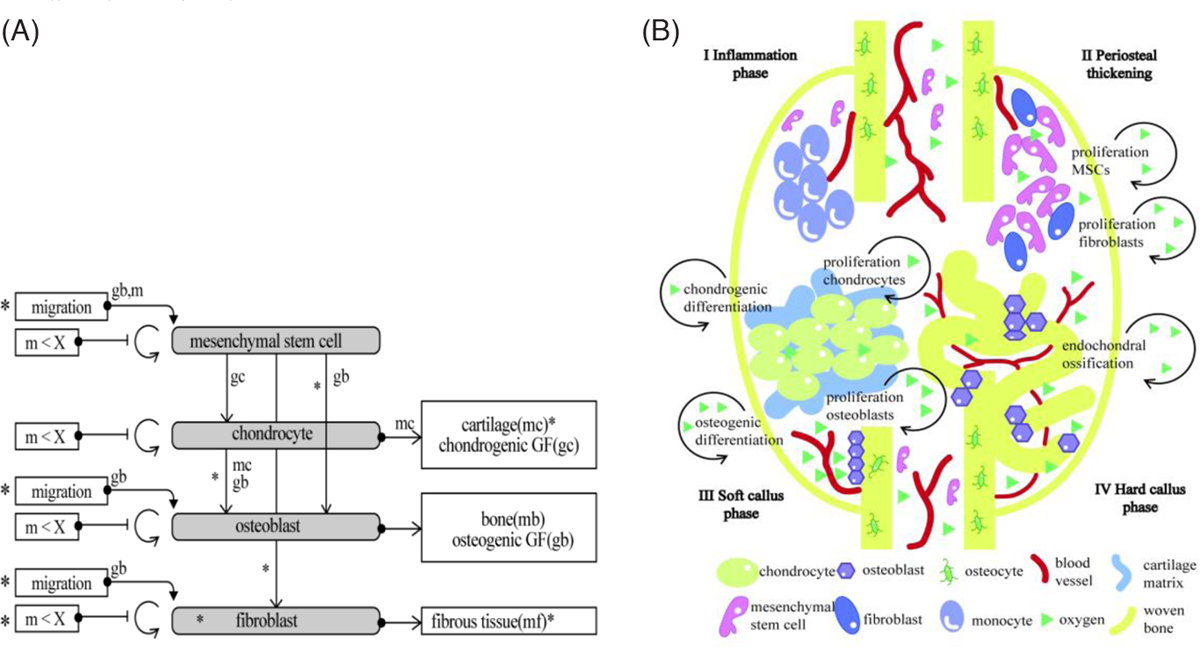
(A) Diagram of cell proliferation, migration, and differentiation (B) Diagram of different stages in the fracture healing process. Proliferation (circular arrow), differentiation (vertical arrow), production of growth factors (gb: osteogenic growth factor, gc: cartilage growth factor), and extracellular matrix (mb: bone extracellular matrix, mc: cartilage extracellular matrix, m: the total matrix).
Current usage metrics show cumulative count of Article Views (full-text article views including HTML views, PDF and ePub downloads, according to the available data) and Abstracts Views on Vision4Press platform.
Data correspond to usage on the plateform after 2015. The current usage metrics is available 48-96 hours after online publication and is updated daily on week days.
Initial download of the metrics may take a while.