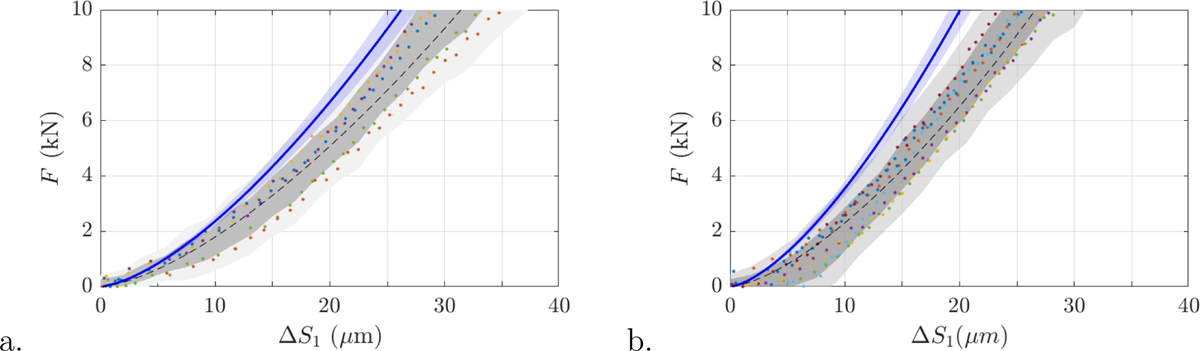
Fig. D1.
Download original image
Force‐deformation curve of the PRSM depending on the number of contacts per roller. Experimental data points belonging to a single loading test are shown with same color. Dark grey shade : 1 σ (Experimental standard deviation). Light grey shade : 2 σ. Dashed line: best fit with 3/2 power law. a. 8 rollers with 19 contacts per roller. b. 8 rollers with 25 contacts per roller.
Current usage metrics show cumulative count of Article Views (full-text article views including HTML views, PDF and ePub downloads, according to the available data) and Abstracts Views on Vision4Press platform.
Data correspond to usage on the plateform after 2015. The current usage metrics is available 48-96 hours after online publication and is updated daily on week days.
Initial download of the metrics may take a while.