Fig. 7
Download original image
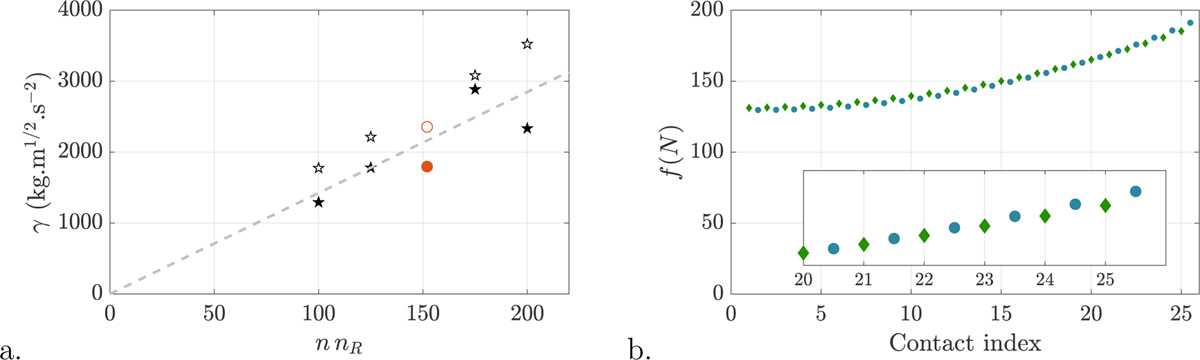
a. Non‐linear mechanism stiffness coefficient, γ, as a function of the number of contacts of the mechanism nnR. Model predictions (hollow symbols) are compared to experimental data points (filled symbols). Star: change of number of rollers. Circle: change of number of contacts per roller. b. Load distribution predicted by the model for F = 30 kN (8 rollers, 25 contacts per roller,
![]() = 150 N). Load distribution is not uniform and concentrates at the force/clamping side. Blue circle: Roller‐screw thread contact. Green diamond: Roller‐nut thread contact.
= 150 N). Load distribution is not uniform and concentrates at the force/clamping side. Blue circle: Roller‐screw thread contact. Green diamond: Roller‐nut thread contact.
Current usage metrics show cumulative count of Article Views (full-text article views including HTML views, PDF and ePub downloads, according to the available data) and Abstracts Views on Vision4Press platform.
Data correspond to usage on the plateform after 2015. The current usage metrics is available 48-96 hours after online publication and is updated daily on week days.
Initial download of the metrics may take a while.