| Issue |
Mechanics & Industry
Volume 20, Number 6, 2019
|
|
|---|---|---|
| Article Number | 601 | |
| Number of page(s) | 8 | |
| DOI | https://doi.org/10.1051/meca/2019035 | |
| Published online | 09 August 2019 | |
Regular Article
Conductimetry technique for the measurement of thin liquid film thickness between two solid surfaces in relative motion: hydrodynamic lubrication
1
LAMIH CNRS UMR 8201, Department of Mechanical Engineering Polytechnic University Hauts-de-France, Campus Mont Houy, 59313 Valenciennes Cedex 9, France
2
IPSA, Department of Mechanical Engineering Energetics and Aerodynamics, 63 Boulevard de Brandebourg, 94200 Ivry-sur-Seine, France
* e-mail: This email address is being protected from spambots. You need JavaScript enabled to view it.
Received:
9
January
2019
Accepted:
16
May
2019
Abstract
This paper presents an approach for the measurement of a liquid film thickness in contact with a rough surface, based on electrical conductance sensor. This type of sensor consists of two electrodes mounted flush on a wall and using an electrolyte solution representing the liquid film. Assessing of the generated current between a pair of electrode is used as a measure of the film thickness. The liquid film is contained between two parallel surfaces that one of which is coated with a certain roughness, while the other is smooth. The electrical probes are placed on the smooth surface and the facing rough surface is removable allowing a free move of the wall. In this way, a rotational or a sliding motion is imposed on the rough wall allowing a browse of an entire surface relative to the electrode, in order to determine the influence of roughness on the film thickness measurements. In addition, series of signal acquisition were carried out with imposed pressures on the upper plate for the characterization of the effect of the film compression on the measured thicknesses. The principle of this electrochemical technique is briefly explained, as well as how the lateral distance between the electrodes impacts the measuring range limit. The experimental setup is described and used to study the liquid film flow with several configurations of the wall surface. The obtained results demonstrated the feasibility of this type of non-intrusive estimation, as it was possible to estimate the variable film thickness which is depending on the peaks and valleys of the rough surface. This is promising, because measuring this parameter remains difficult. Finally, the results analysis allows to synthesize the advantages and limitations of this method.
Key words: Conductimetry / rough surface / film thickness / electrochemical probes
© AFM, EDP Sciences 2019
1 Introduction
In various technical applications, liquid films wetting surfaces (stationary or mobile) can play a key role; as a heat transfer vector, such as in the packing on the distillation towers or on fuel rods of boiling water reactors, were the liquid film presents a necessary condition to provide a favorable environment. Moreover, in almost all mechanical applications, the liquid film can also be involved as a lubricant to avoid or to reduce problems and drawbacks, such as the friction and the wear in the sliding bearings in which the surfaces are in contact in a relative motion. In fact, friction takes place due to the surface irregularity. Even the best machined surfaces, present valleys and peaks called roughness. So, during the contact between two surfaces, peaks and valleys of the different surfaces rubs each other and then make actual contact. These contacts support the normal load and deform plastically and get cold welded. In the most of cases, the presence of friction in certain machinery can be really harmful by reducing the productivity, the effectiveness and eventually the failure of bearings.
At this point, the interest of the measurement of the lubrication film thickness arises as a quantitative way for reducing the tribological problems and so, the optimization of industrial process.
However, during the lubrication regime, unlike smooth surface when surfaces are irregulars, pressure and surface roughness may influence on the liquid film thickness between the two working surfaces. The knowledge of the irregularities effects on the liquid film thickness plays an important role for the inspection and the control of the lubricating systems on a given mechanism.
Various techniques based on different principles, can be used for measuring the liquid film thickness. Usually, some optical techniques based on the photons' propagation and reflection, from a material [1–3] or the extraction of the film by suction [4–6], or ultrasound method [7–8] are used. These methods are generally employed for the two-phase flow. Electrical methods have been widely applied for single phase film in the area between inert walls. The principle of these techniques is commonly based on the measurement of the electrically conductance between a pair of electrode relating with the liquid film thickness, otherwise, the measurements of electrical capacitance as an alternative when non-conductive fluids are involved [9–11].
In this current work, the electrical conductance of the liquid film is measured using platinum wire sensor diameter d = 0.95 mm for a signal acquisition. These probes are wisely polished that they perfectly flush the film flow presenting therefore a non-intrusive technique. The theory allowing the prediction of the electrical conductance of the probe as a function of the film thickness and the particular probe designs was presented by Coney [12]. The advantage of this method is its relative ease of use and its low cost [10]. In addition, the frequency response of the probes is generally sufficient for monitoring the thickness variation of the liquid film. In order to avoid the probes polarization, a high frequency of alternating current is used, so that the quantity of the electricity carried during one half cycle is insufficient to produce any measurable polarization. In this case, we use a frequency f = 50 KHz for the signal applied to the probes. This provides a resistance between the two probes only function of the film thickness since the admittance of sensor-liquid interface (depending on the signal frequency) becomes negligible compared to the conductance of the liquid film. Cognet et al. [13] showed that the admittance reaches a threshold limit above f = 20 KHz from which it start to behaves like a pure conductance.
In the present experimental work, the conductimetry method is used in order to measure an irregular thickness of a liquid film, caused by its contact with a rough surface. The objective is to provide a reliable method to characterize the influence of pressure and roughness variation on this liquid film thickness. The rough wall is moving with a rotational motion relative to the surface where the probes are implanted to enable scrolling a total section above the probe and thus to detect different variation of the film thickness. Hence, the effects of a step change in thickness are firstly investigated. Also, the variation of the liquid thickness under a pressure hold is experimentally examined.
 |
Fig. 1 3D conception (left) versus real experimental (right) setup: (a) Electrical motor; (b) Film recipient; (c) Conductimetric device; (d) Output to acquisition system. |
2 Experimental arrangements
2.1 Experimental facility
The electrodes used in our experimental facility are made of circular platinum wire of a diameter ds = 0.9 mm. These probes are mounted flush on a plexiglas block surface and well-polished. So, their surfaces won't disturb neither the flow near the wall nor alter the measurements. The choice of measurement probes (geometries and distance between electrodes) depends on the thickness of the liquid film to be measured. Thus, in order to study a wide range of liquid film thicknesses, we have placed a series of probes, separated by different distances l , in the bottom of a circular recipient allowing a rotating motion of the rough upper surface. Each conductimetric probe is constituted by two similar electrochemical probes separated by a distances l . An adjustable rotational speed electric motor is positioned on the top and it is maintained by a solid structure constituted by Aluminium profiles, ensuring this rotation motion (Fig. 1). A data acquisition system (Keithley DAS-1800 ST acquisition card), was used for the conductimetric measurements' technique. This system allows obtaining 16 differential signals with a known sampling frequency, fs varying until 333 kHz (for one channel), and total time, Ts. The measured analog signal is converted into a digital one (12 bits) with the “TestPoint” software, which controls the DAS-1800 ST card via Matlab® programmes.
Figure 2 represents the location of the conductimetry probes, which are in the middle of the recipient. Every group contains six probes which are distant consecutively from A to F by l = 2, 2.5, 3.5, 4.5, 5.5 and 6 mm allowing to measure different film thickness ranges and from different positions. The same distance repartition is also considered from G to L, and from M to R. The connectors of these probes are located at the edge of the probes' holder. The principle of the measuring system of the film thickness is illustrated in Figure 3.
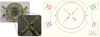 |
Fig. 2 Electrodes' arrangement in the bottom inert surface. |
 |
Fig. 3 Measurement test-section of liquid film thickness “e”. |
 |
Fig. 4 Simplified sketch of the conductimetry measurement device. |
2.2 The conductimetric technique
The study was focused on the measurements of different thicknesses of a liquid film sandwiched between two parallel mechanical surfaces in relative movement and where one of them is rough and the other is smooth. This method is applicable to an electrically conductive liquid situated between two non-conductive surfaces. Thus, the liquid film used during all the experimentation is an aqueous solution of ferri-ferrocyanide redox couple (fast electrochemical reaction), selected for its good electrical conductivity and its small sensitivity to the light [14]. This electrical conductivity depends on an electrochemical concentration, which is in our case about 20 mol/m3.
For measuring the conductance of the film thickness between the two electrodes located in the same smooth inert wall (mechanical surface), an alternative voltage is imposed between them using a frequency generator with variable frequencies and fast response in time. A square alternative voltage E(t) is then applied between these two electrodes (sensors) with a zero as average and a range of high variable frequencies (from 50 to 100 kHz) in order to prevent the probes polarization. The internal generator resistance r
0 is adjusted to obtain an output direct voltage which is proportional to the conductance G of the liquid film. This relationship is given below: (1)
(1)
In order to obtain at the output a signal u(t) proportional to the conductance of the film, the voltage V is amplified, corrected and filtered (Fig. 4). The frequency used for the signal applied to the probes (electrodes) is fixed more than 50 kHz providing a resistance between the two probes only function of the film thickness as the admittance (1/Z) becomes negligible compared to the conductance G of the liquid film [13].
2.2 Calibration procedure
Firstly, a calibration for the conductimetry system is required. This calibration allows to get the voltage response after applying various and known resistances to its input terminals. Hence, the internal or the range of the resistance r 0 is selected. This range gives us, without saturation, the relationship between the obtained voltage and the applied conductance G (or resistance) (see Fig. 5). It can be noted here that in the vicinity of zero conductance G , it is so difficult to obtain the very small voltage which is very close to zero because of the high device fluctuating measured values. In fact, the smallest obtained DC voltage measurements can be easily affected by the systematic error of the device. The lower conductance doesn't correspond to that of the real liquid fluid which is very high. So, the range of real measurements is hence outside that of the nonlinear part shown in Figure 5.
For experiments, a particular choice of probes according to the separation distances l must be carried out, depending on the concerned thickness film. For this aim, a calibration for the conductimetric probes is required. This calibration had been done on the relationship between the output signal of the conductance probes and the thickness of the liquid aqueous solution in the recipient. This thickness was obtained by calibrating the distance “e” between the upper and the bottom surfaces, using a non-conductive thin plastic sheets. The obtained results are illustrated by Figure 6.
The representation of the output signal as a function of the liquid film thickness, shows that the maximum value of the thickness is limited by the saturation of the conductance curves. For a given electrode distance l, curves saturate less quickly when the diameter of the electrode increases (large surface S), whereas the electrodes which are more distant can measure larger film thicknesses. Hence, for checking the small variations of the film thickness (in the order of microns), we had chosen (for the following works), a couple of electrodes AB corresponding to the closet spacing l (l = 2 mm) thus avoiding a mean change measurement and giving so the better accurate measurements.
For this aim, the AB probe calibration curve is used. In this case, the evolution of the output signal according to the thickness e presents a slow growth for values less bigger than 1.5 mm, and tending toward a vertical plateau for thickness relatively important. Therefore, to determine the adequate fitting equations, the whole curve has been subdivided into slices to determine the well-fitting equation of each segment. The calculated error based on the resulting equation is less than 2%. The equations are then listed in a Matlab program related to the acquisition system, allowing the conversion of the instantaneous measured voltage into a temporal liquid film thickness.
 |
Fig. 5 Calibration of the conductimetric system using passive resistances at f = 50 kHz. |
 |
Fig. 6 Calibration curves for the different conductimetric probes. |
3 Experimental results
The experimental setup described in Section 2 is used to measure the thickness of a liquid film located between two flat inert surfaces. We focused our attention in this study on the effects of a rough surface on the film thickness time-variation. The effect of an additional force exerted by a given mass on this surface was also analyzed, in order to see the influence of pressure on the film thickness evolution. For this raison, the inert bottom surface, containing the probes was kept smooth, whereas a roughness was applied to the upper flat one (Fig. 7). A rotational or a sliding motion is also imposed on this surface in order to browse an entire area over the probe and then checking the dynamic effects on the liquid thickness e.
 |
Fig. 7 Schematic representation of the experimental measuring principle. |
3.1 Effects of a rough surface on the thickness film measurements
The roughness was achieved by sticking sandpaper to the upper surface. Firstly, the method was tested with four commercial sandpapers P180, P800, P1200 and P2500 with a respective average grit size of 78, 21.8, 15.3 and 2 μm and the upper surface was kept fixed. A very small gap e = 20 μm, is firstly considered, between the upper roughened surface and the lower one containing the probes, that corresponds to the gap separating the edges of the roughness and the smooth inert surfaces. Comparing the liquid film thickness obtained, the effect of the added roughness is well confirmed by the conductimetric method. For a small roughness (about 2 μm) the measured film thickness is the lowest one and it is very close to the initial distance between the two surfaces (2.3 μm), while for a large grit sizes of rough surface, the measured film thickness is greater. The value of the added thickness, relative to the initial gap corresponds approximately to the average dimension of the interstice between the grit around 76.6 µm for P180 (78 μm) and 3 μm for P2500 (2 μm). Figure 8 shows the measured thickness values for the various rough surfaces applied. The adding of the trend curve of the thickness film evolution according to the roughness grit size, gives a straight line with y-intercept ≈120 μm, corresponding to the initial distance separating the two plates (e = 120 μm), and a gradient ≈1 which means that the obtained thickness film is almost equivalent to the granularities' gap. This first type of used rough surfaces allowed the checking of the sensitivity of the method and the device to measure the thickness of the film in contact with a rough surface. The results show that this method can be accurately used to measure the thickness of a liquid film and can precisely detect the various irregularities created by such rough surfaces. In a second case, we tried to analyse the effect of compressing the liquid film on the measurements results.
 |
Fig. 8 Liquid film thickness obtained for different rough surfaces during static trial. |
3.2 Effects of a pressure load
In this part, we studied the effect of adding a load pressure to the upper roughened wall, on the obtained film thickness. For this purpose, we used plates with a same shape, a same surface area and identical to the rough upper surface. These plates were firstly weighed, in order to assess the precisely pressure on the liquid film. Thus, to increase the pressure load, we stacked several plates which induce the compression of the liquid film and so reducing its initial thickness. The main purpose of this study is to analyse the effect of the gradual reduction of the initial distance e between the two surfaces, on the probe response as for the thickness liquid film measurement in contact with the rough surface. The obtained results are shown in Figure 9, which plots the evolution of the measured liquid film thickness according to the applied load pressure.
The obtained curves are decreasing and tend to a constant value for a certain pressure load level. That is, by increasing the pressure load on the upper surface, the liquid film thickness tends to be compressed and reduced until it will be nearly stable and steady. This limit constant value of the liquid film thickness is almost equal to the roughness grit size. From a certain level of the load pressure on the upper surface, this latter joins the lower surface and the liquid filled the interstices between the spaces roughness. Therefore, the thickness detected by the electrode corresponds to the size of the irregularity.
 |
Fig. 9 Effect of pressure load on the liquid film thickness. |
3.3 Thickness film measurements with a moving roughened wall
In a second case, we analysed the effect of adding a motion to the upper wall, on the obtained film thickness. For this case, we used specific rough surfaces, characterized by homogeneous and sequentially irregularities, in order to analyse the probe response in terms of a stepwise change of the film thickness.
Three types of specific surfaces are then used, a plastic surface, with a step change pattern with a 0.6 mm as a total thickness and two commercial plastic canvas with different mesh as respectively thickness 0.25 and 0.3 mm. Figure 10 represents the photographies of these three applied surfaces.
We chose these basic configurations to test the performance of the conductimetric method on the tracking of the different film thickness variations caused by the irregularity of the inert upper surface. Indeed, with the rotational movement of the top surface (low velocity), a full area of the rough surface is covered above the electrodes. This causes a harmonic variation of the liquid film thickness, corresponding to the different surface deformations. The response of the conductimetric probes converted into a film thickness according the acquisition time, are illustrated by Figures 10a and b.
For the two plastic canvas (Fig. 10a and b), which represent the same shape of the mesh with different thicknesses (0.25 and 0.3 mm), results show a fluctuating thickness of the film with a short period corresponding to the passage of the edges of each mesh of the fabric by the measurement area. The mean amplitude of these fluctuations is 0.308 mm and 0.324 mm, respectively for the canvas 1 and 2. These values are well above the depth of the mesh grid (about 0.05 mm). This difference is caused by the upper wall movement, leading to a disturbance of the near wall zone due to elevated friction caused by the irregularities of the moving surface.
For the surface with the square wave form (Fig. 10c), the measured electrodes' response is shown in Figure 11c. The time-evolution of relative thickness, obtained by subtracting the initial thickness of the liquid film at rest, is represented in this Figure 11c. The obtained result is a periodic curve with a period of T ≈ 4 s, corresponding to the passage-time of the step edge by the measurement area. Hence, the time between two successive peaks represents the electrode sweep of the cavity between two neighboring steps. The maximum amplitude measured is 650 μm, which corresponds to the depth of the cavity for an actual thickness of the surface equal to 600 μm. The reason for this small difference is due to the disturbance of the flow in the vicinity of each step.
 |
Fig. 10 Specific used surfaces: (a) Plastic canvas (e = 0.25 mm); (b) Plastic canvas (e = 0.3 mm); (c) Plastic canvas (e = h = 0.6 mm). |
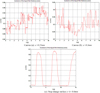 |
Fig. 11 Conductimetric probes' responses of the specific used surfaces. |
4 Conclusions
An experimental approach for the measurement of a liquid film thickness in contact with a rough surface is presented. The concept is based on the implementation of conductance probes flushing an electrolyte film which is contained between two parallel inert surfaces. The upper surface, facing the probes, was coated with a given roughness, in order to check the influence of this wall aspect on the liquid film thickness. A rotational motion can also be imposed on the upper inert roughened surface, to allow a browse of an entire rough area by the measurement zone and so, determining the different irregularities with time.
For this purpose, the device was firstly calibrated using a commercial rough surface consisting of a fixed solid sand grit with a known size. Then, a different load pressures were imposed on the upper inert surface in order to compress the liquid film. The obtained electrodes response shows that the measured thickness film approaches to the grit thickness for a high load, which corresponds to the case where the rough surface touches the bottom one. These obtained results show the good performance of this method which have detected the precisely thickness deformation of the liquid film in contact with the rough surface and measured size gap between the grits. A controlled rotational motion was also imposed on the upper surface using a specific deformed surface in order to locate these particularities with the conductimetry method. The obtained results, especially for the step change surface, highlight the accuracy of this technique, which gives the different time-variation of the upper surface liquid film thickness. This method shows good performances on the measurement of the variation of the liquid film thickness due to a rough surface contact.
Acknowledgments
This work was supported by the laboratory LAMIH CNRS UMR 8201 (Polytechnic University Hauts-de-France), Department of Mechanical Engineering. This support is gratefully acknowledged.
References
- A. Donniacuo, R. Charnay, R. Mastrullo, A.W. Mauro, R. Revellin, Film thickness measurements for annular flow in mini-channels: description of the optical technique and experimental results, Exp. Therm. Fluid Sci. 69 , 73–85 (2015) [CrossRef] [Google Scholar]
- A. Schagen, M. Modigell, G. Dietze, R. Kneer, Simultaneous measurement of local film thickness and temperature distribution in wavy liquid films using a luminescence technique, Int. J. Heat Mass Transf. 49 , 5049–5061 (2006) [Google Scholar]
- J.E. Steinbrenner, C.H. Hidrovo, F.M. Wang, S. Vigneron, E.S. Lee, T.A. Kramer, C.H. Cheng, J.K. Eaton, K.E. Goodson, Measurement and modelling of liquid film thickness evolution in stratified two-phase microchannel flows, Appl. Therm. Eng. 27 , 1722–1727 (2007) [Google Scholar]
- M.A. Lopez de Bertodano, C.S. Jan, S.G. Beus, Annular flow entrainment rate experiment in a small vertical pipe, Nucl. Eng. Des. 178 , 61–70 (1997) [CrossRef] [Google Scholar]
- R.J. Belt, J.M.C. Van't Westende, H.M. Prasser, L.M. Portela, Time and spatially resolved measurements of interfacial waves in vertical annular flow, Int. J. Multiph. Flow 36 , 570–587 (2010) [CrossRef] [Google Scholar]
- P. Ju, C.S. Brooks, M. Ishii, Y. Liu, T. Hibiki, Film thickness of vertical upward co-current adiabatic flow in pipes, Int. J. Heat Mass Transf. 89 , 985–995 (2015) [Google Scholar]
- K. Zhang, Q. Meng, T. Geng, N. Wang, Ultrasonic measurement of lubricant film thickness in sliding Bearings with overlapped echoes, Tribol. Int. 88 , 89–94 (2015) [Google Scholar]
- L. Meng, J. Minqing, C. Zengfan, L. Heng, An improved ultrasonic method for lubricant-film thickness measurement in cylindrical roller bearings under light radial load, Tribol. Int. 78 , 35–40 (2014) [Google Scholar]
- Z. Cui, C. Yang, B. Sun, H. Wang, Liquid film thickness estimation using electrical capacitance tomography, Meas. Sci. Rev. 14 , 8–15 (2014) [CrossRef] [Google Scholar]
- G.F. Hewitt, G.J. Collier, Film thickness measurement in two-phase flow, Br. Chem. Dig. 12 , 709–714 (1967) [Google Scholar]
- G.R. Thwaites, N.N. Kulov, R.M. Nedderman, Liquid film properties in two-phase annular flow, Chem. Eng. Sci. 31 , 481–486 (1976) [Google Scholar]
- M.W.E. Coney, The theory and application of conductance probes for the measurement of liquid film thickness in two-phase flow, J. Phys. E6 , 903–910 (1973) [Google Scholar]
- Q. Yu, G. Cognet, Conductive probes for the measurement of liquid film thickness, Experiments of fluid, Internal Report, LEMTA-INPL, Nancy, France, 1988 [Google Scholar]
- M. Lebouché, Contribution à l'étude des mouvements turbulents des liquides par la méthode polarographique, PhD thesis, Es Sciences, Nancy, France, 1968 [Google Scholar]
Cite this article as: F. Aloui, L. Gaied, W. Abassi, M. Lippert, M. Bigerelle, Conductimetry technique for the measurement of thin liquid film thickness between two solid surfaces in relative motion: hydrodynamic lubrication, Mechanics & Industry 20, 601 (2019)
All Figures
|
Fig. 1 3D conception (left) versus real experimental (right) setup: (a) Electrical motor; (b) Film recipient; (c) Conductimetric device; (d) Output to acquisition system. |
| In the text | |
|
Fig. 2 Electrodes' arrangement in the bottom inert surface. |
| In the text | |
|
Fig. 3 Measurement test-section of liquid film thickness “e”. |
| In the text | |
|
Fig. 4 Simplified sketch of the conductimetry measurement device. |
| In the text | |
|
Fig. 5 Calibration of the conductimetric system using passive resistances at f = 50 kHz. |
| In the text | |
|
Fig. 6 Calibration curves for the different conductimetric probes. |
| In the text | |
|
Fig. 7 Schematic representation of the experimental measuring principle. |
| In the text | |
|
Fig. 8 Liquid film thickness obtained for different rough surfaces during static trial. |
| In the text | |
|
Fig. 9 Effect of pressure load on the liquid film thickness. |
| In the text | |
|
Fig. 10 Specific used surfaces: (a) Plastic canvas (e = 0.25 mm); (b) Plastic canvas (e = 0.3 mm); (c) Plastic canvas (e = h = 0.6 mm). |
| In the text | |
|
Fig. 11 Conductimetric probes' responses of the specific used surfaces. |
| In the text | |
Current usage metrics show cumulative count of Article Views (full-text article views including HTML views, PDF and ePub downloads, according to the available data) and Abstracts Views on Vision4Press platform.
Data correspond to usage on the plateform after 2015. The current usage metrics is available 48-96 hours after online publication and is updated daily on week days.
Initial download of the metrics may take a while.