Fig. 2
Download original image
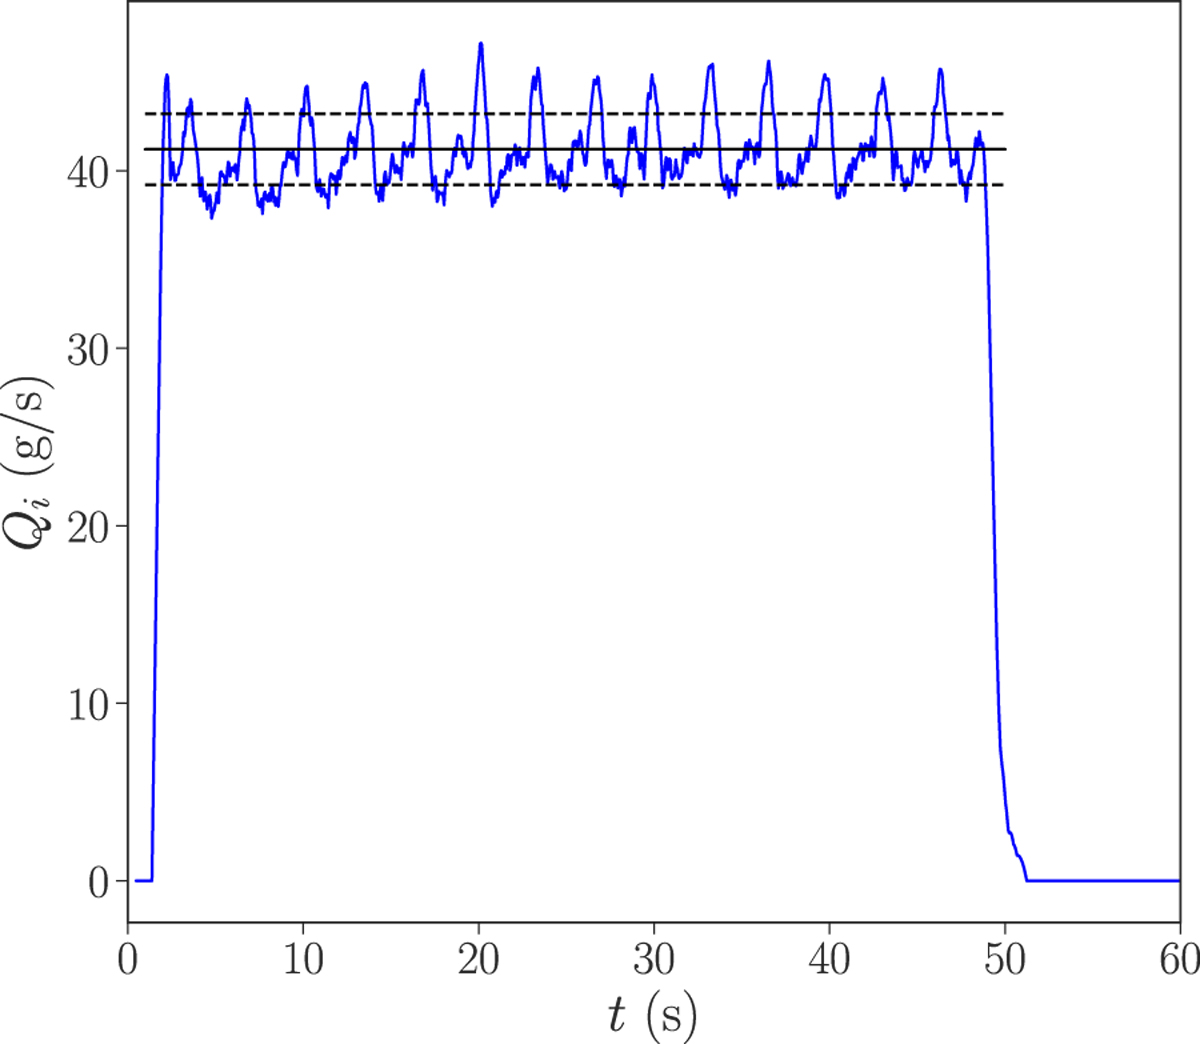
Temporal evolution of the instantaneous mass flow rate Qi for dp = 190 μm, D = 12 mm with obstacle (Dobs = 20 mm and hO = 5 mm). The horizontal full line represents the mean flow rate, Q, whereas the dashed lines represent the standard deviation.
Current usage metrics show cumulative count of Article Views (full-text article views including HTML views, PDF and ePub downloads, according to the available data) and Abstracts Views on Vision4Press platform.
Data correspond to usage on the plateform after 2015. The current usage metrics is available 48-96 hours after online publication and is updated daily on week days.
Initial download of the metrics may take a while.