Fig. 4
Download original image
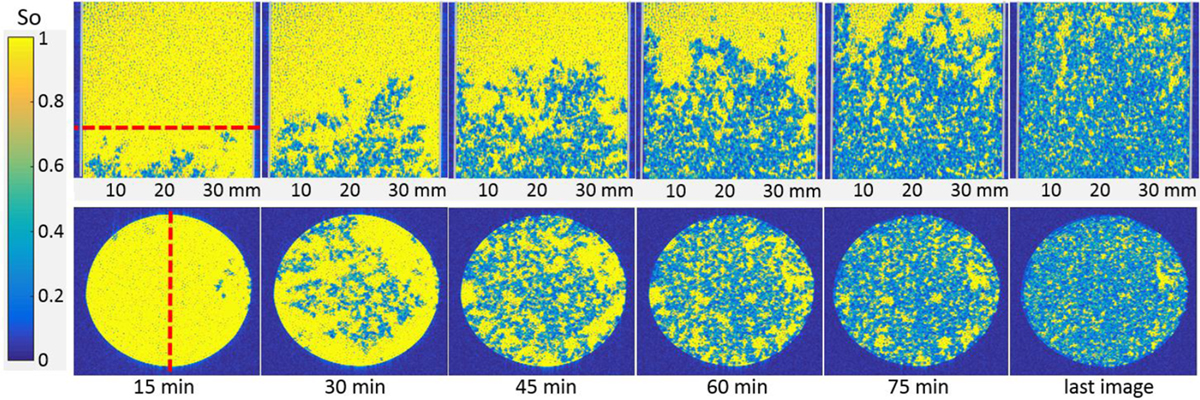
Consecutive MRI images of the water–oil displacement in the model of polystyrene beads with the injection flow rate of 0.12 mL/min. The oil is yellow and the water is light blue. The acquisition of MRI signal was made each 15 minutes and shown here from the first water appearance in FOV. The dotted line on the first vertical section indicates the position of the horizontal sections (and vice-versa for the horizontal section below).
Current usage metrics show cumulative count of Article Views (full-text article views including HTML views, PDF and ePub downloads, according to the available data) and Abstracts Views on Vision4Press platform.
Data correspond to usage on the plateform after 2015. The current usage metrics is available 48-96 hours after online publication and is updated daily on week days.
Initial download of the metrics may take a while.