Fig. 5
Download original image
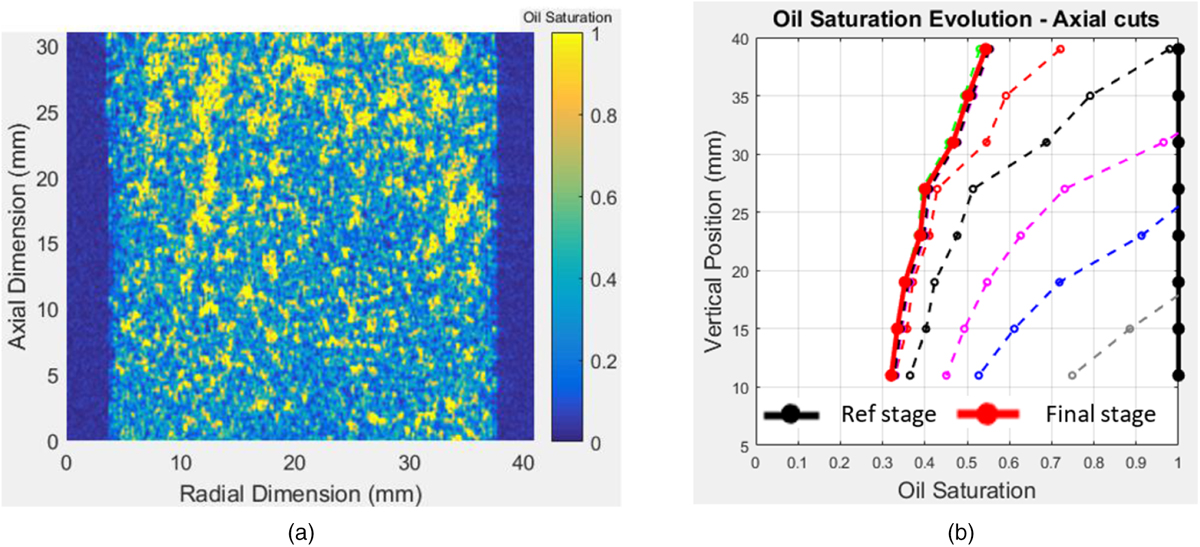
Residual oil saturation image in a vertical section (a) for the displacement process after the injection of 3.5 PV of the displacing fluid. Time evolution of oil saturation profiles deduced from the 8 axial sections (b).
Current usage metrics show cumulative count of Article Views (full-text article views including HTML views, PDF and ePub downloads, according to the available data) and Abstracts Views on Vision4Press platform.
Data correspond to usage on the plateform after 2015. The current usage metrics is available 48-96 hours after online publication and is updated daily on week days.
Initial download of the metrics may take a while.