Fig. 8
Download original image
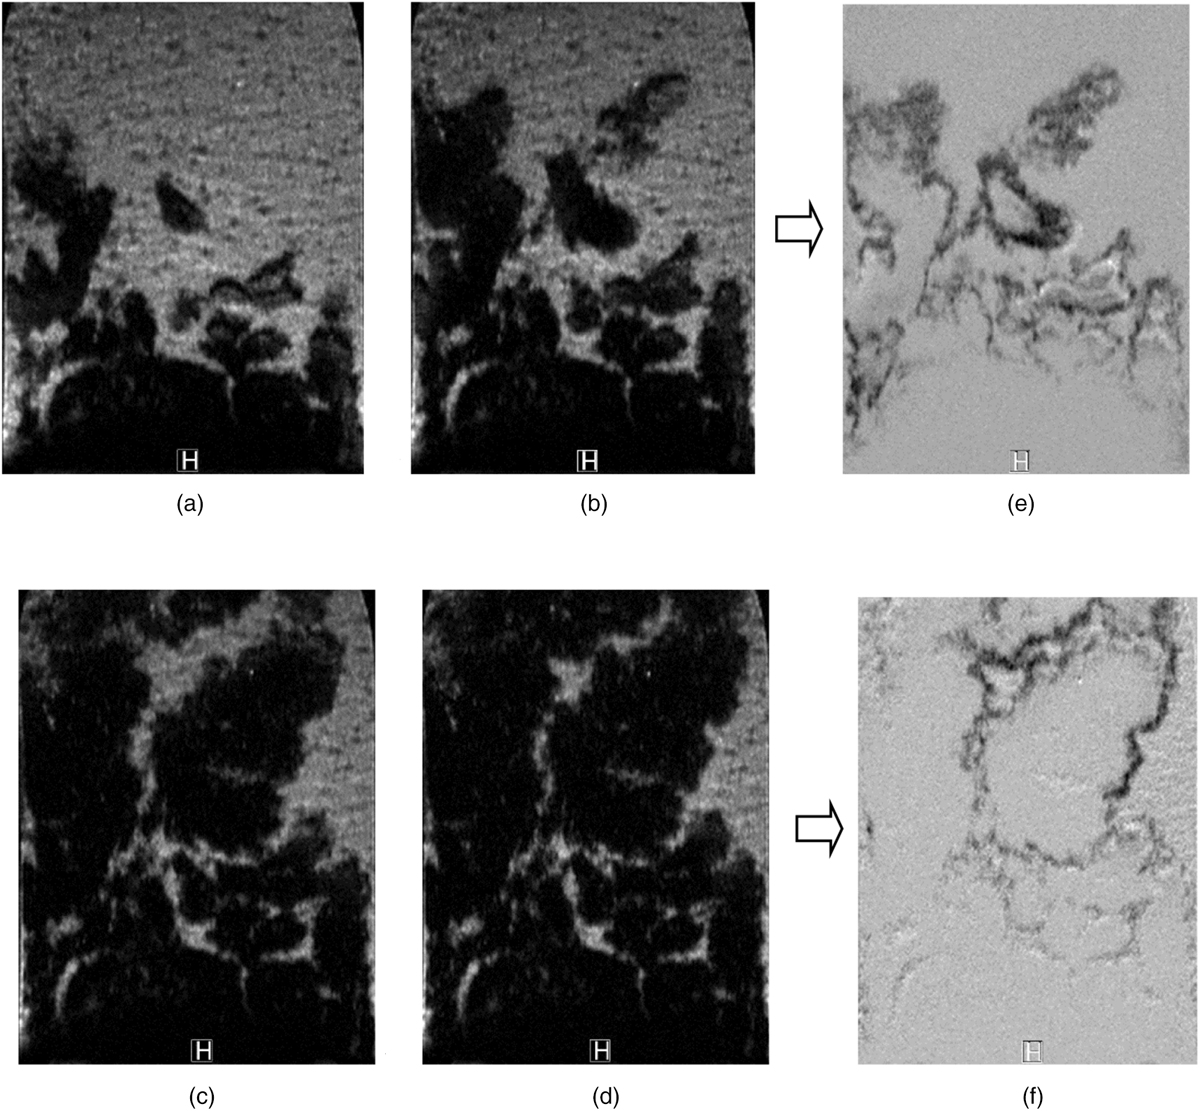
Oil–water displacement in the sand model, Qinj = 0.12 mL/min: (a–d) consecutive images of fingers growth with an interval of 15 minutes; (e): difference between images (a) and (b). (f): difference between images (c) and (d). These two images of saturation difference show the local area where the displacement happens.
Current usage metrics show cumulative count of Article Views (full-text article views including HTML views, PDF and ePub downloads, according to the available data) and Abstracts Views on Vision4Press platform.
Data correspond to usage on the plateform after 2015. The current usage metrics is available 48-96 hours after online publication and is updated daily on week days.
Initial download of the metrics may take a while.