Fig. 8
Download original image
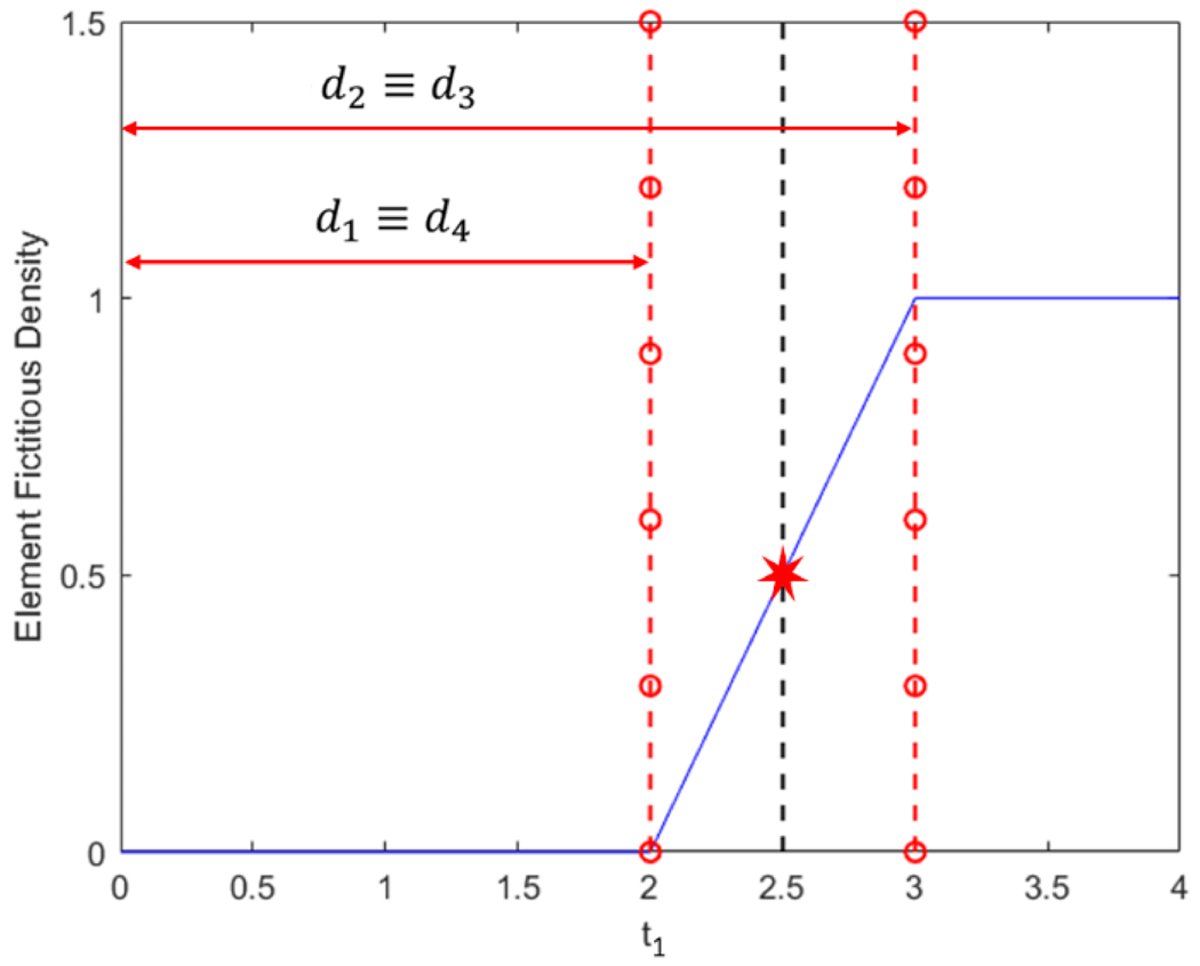
Fictitious density plot depending on the thickness t1 considering the element C from the example in Figure 7. The distances d1 (that is equal to d4) and d2 (that is equal to d3) are reported with red dot-dashed lines, t1 is set along vertical black dashed lines and the fictitious density for t1 is reported with a red star in the graph.
Current usage metrics show cumulative count of Article Views (full-text article views including HTML views, PDF and ePub downloads, according to the available data) and Abstracts Views on Vision4Press platform.
Data correspond to usage on the plateform after 2015. The current usage metrics is available 48-96 hours after online publication and is updated daily on week days.
Initial download of the metrics may take a while.