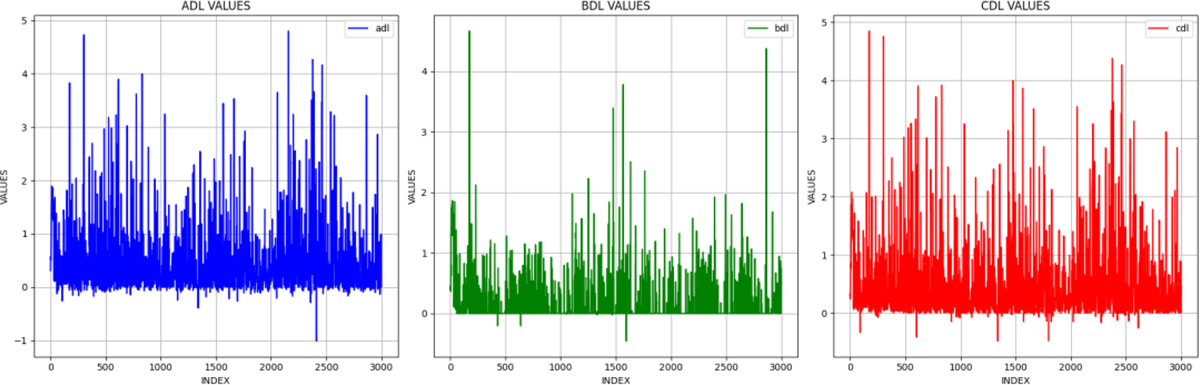
Fig. 3
Download original image
Sample current measurements from the power grid dataset. The three channels (ADL, BDL, CDL) show varying levels of volatility, with CDL exhibiting the highest amplitude fluctuations and ADL showing frequent directional changes, while BDL remains relatively stable.
Current usage metrics show cumulative count of Article Views (full-text article views including HTML views, PDF and ePub downloads, according to the available data) and Abstracts Views on Vision4Press platform.
Data correspond to usage on the plateform after 2015. The current usage metrics is available 48-96 hours after online publication and is updated daily on week days.
Initial download of the metrics may take a while.