| Issue |
Mechanics & Industry
Volume 27, 2026
Artificial Intelligence in Mechanical Manufacturing: From Machine Learning to Generative Pre-trained Transformer
|
|
|---|---|---|
| Article Number | 13 | |
| Number of page(s) | 15 | |
| DOI | https://doi.org/10.1051/meca/2026007 | |
| Published online | 03 April 2026 | |
Original Article
Deep learning-driven intelligent data anomaly detection and repair technology for power grids
Department of Information Center, Yunnan Power Grid Co., LTD, Kunming 650100, Yunnan, PR China
* e-mail: This email address is being protected from spambots. You need JavaScript enabled to view it.
Received:
15
August
2025
Accepted:
26
January
2026
Abstract
Modern power grids face growing challenges from aging infrastructure, renewable integration, and unstable network. However, traditional monitoring systems struggle with complex data anomalies such as missing values, noise, and static thresholds. To address this, we propose a hybrid deep learning framework that combines the Qwen2 large language model with a novel TimeMixer++ architecture for intelligent anomaly detection and data repair. Our method fuses multi-modal inputs—including voltage, weather, and sensor data—and uses context-aware imputation and multi-scale temporal modeling to reconstruct missing or corrupted time series segments. A generative pipeline further enhances robustness in noisy or incomplete settings. Evaluated on real-world datasets from the Yunnan Power Grid and the IEEE 39-bus system, our approach achieves significantly lower mean absolute error (MAE) and mean squared error (MSE) than conventional baselines (e.g., ARIMA, GANs), especially under high data loss. The framework enables proactive maintenance by producing accurate, interpretable, and physically plausible reconstructions. This work demonstrates a scalable, data-driven path toward resilient grid operations, with potential applicability to diverse smart infrastructure systems.
Key words: Deep learning / time series analysis / data imputation / hybrid models / smart grids
© L. Tang et al., Published by EDP Sciences, 2026
 This is an Open Access article distributed under the terms of the Creative Commons Attribution License (https://creativecommons.org/licenses/by/4.0), which permits unrestricted use, distribution, and reproduction in any medium, provided the original work is properly cited.
1 Introduction
The current power grid has become an essential aspect of development in society and in the economy, delivering the energy foundation of industry, consumers, and key infrastructure facilities. But the grid is under the unprecedented challenges posed by the global increase in energy demands and rising concerns about environmental requirements that jeopardize its reliability, efficiency, and sustainability. The lack of modernization of aging infrastructure, the incorporation of renewable celebrities, and the emergence of cyber threats have demonstrated how inadequate and limited are the traditional grid management systems. Such problems not only undermine the capacity of the grid to supply the growing needs but also present some threats to the safety of the populace and the economy. To deal with these obstacles, one needs clever solutions that can bring together the best in data analytics and intelligent technologies to revolutionize the way grids operate [1].
Deterioration of aging infrastructure is one of the major most urgent challenges. Numerous power systems were made a few decades ago and are currently functioning outside their life spans [2]. Transformers, transmission lines, and substations have tendency to failure as causes are material fatigue, corrosion, and lack of maintenance. As an example, IEEE 39-bus system, which is a commonly considered test bed of grid stability, illustrates how old components cause cascading outages during peak loads. Conventional monitoring tools, like manual checks and frequent repair, are slow because they are reactive, and are usually not able to identify faults at their initial stages. This culminates with extended outages, higher repair expenses and energy outage. Adding to the setbacks is the constraint of the traditional grid management strategies. Historical data and static thresholds are frequently used in conventional fault detection systems but are not sufficient to capture very small deviation in high-dimensional time series data that is inherently complex in nature. To take an example, ring faults can be unseen until they transform into complete-scale failures because they are linked to voltage changes. Procedural based repair strategies on the other hand do not take into consideration real time variables like weather or grid topology. It makes the process of responding to new threats cumbersome, hence resulting in ineffective distribution of resources and slow recovery.
The nature of these problems has necessitated seriousness to the extent that researchers have resorted to intelligent technologies as possible solutions. The Deep learning and machine learning models, including the Long Short-Term Memory (LSTM) networks [3], Generative Adversarial Networks (GANs) [4] provide promising directions in fault prediction, anomaly detection, and repair planning [5]. Nonetheless, the current solutions tend to be insufficient in terms of scalability and flexibility needed to implement them in the real grids. To give an example, models trained on synthetic data are unlikely to generalize heterogeneous data such as the Electric Power Research Institute (EPRI) real-life operational data [6].
In this study, the combination of the time series analysis with large language models (LLM), including Qwen2, and hybrid structures, such as TIMEMixer++, is a breakthrough in discussing the problem of power grid. Using the processing capabilities of multi-modal Qwen2 data sets (e.g. sensor readings, weather, and historical trends) and contextually intelligent results, not only will this solution address some critical shortcomings in fault localization, missing data imputation, and decision-making under uncertainty but also provide TIMEMixer++ as a new framework that improves robustness by using multi-resolution time imaging, cross-variable attention mechanisms, and adversarial training. The hybrid nature of the TIMEMixer++ (which has been developed on top of contextual fusion abilities of Qwen2) can accurately model temporal dependency, and thus predict faults reliably even in a noisy setting. Such two-pronged solution can enhance accuracy of grid surveillance, as well as provide proactive maintenance plans that can reflect the dynamic nature of energy systems, including renewable energy integration and aging resilient infrastructure. The style of interpretability provided separately by Qwen2 and the flexibility of the computation offered by TIMEMixer++ has defined a new benchmark in scalable physics-informed data-driven applications in smart grids [7, 8].
In the given work, the researcher seeks to ask the question how the Qwen2 large language model can be used to normalize and complete time series data in power grid systems, including the solution to the problem of discontinuities and noise. These conventional processes such as ARIMA or LSTM tend to fail when dealing with grid data that is not among simple patterns, especially when the results must be interpreted as input that is diverse such as the changes in voltages, weather conditions, and device logs. This is because there is an opportunity to use the potential of the Qwen2 system to handle multi-modal data to integrate a temporal context and contextual relations to be used to restore the lost information. E.g. Qwen2 will be able to interpolate missing data points by looking at historical trends in voltages correlated with other environmental factors (e.g. temperature, humidity) in situations where sensor failure or erratic disruption is possible. Moreover, the given model allows creating realistic portions of time series using its generative capabilities and finally maintains continuity in datasets such as the IEEE 39-bus system or actual records of loads. This solution is not only accurate with fault identification, but it can also assist with proactive maintenance since downstream activities will be better facilitated with solid imputation. By focusing on the useful integration of Qwen2 into grid practices, the study addresses the general gap between general-purpose and more specific needs in the domain of fine-tune and feature mapping [9]. The main contributions of this study are as follows:
This work proposes a novel method using Qwen2’s multi-modal fusion to repair grid time series by combining voltage, weather, and sensor data for context-aware imputation.
It introduces a generative pipeline to synthesize missing grid data, enhancing the robustness of fault prediction in noisy or incomplete datasets.
The study demonstrates how Qwen2’s architecture can be adapted for grid-specific tasks, improving the efficiency of time series analysis in real-world applications.
2 Literature review
2.1 Deep learning for data fault detection
Deep learning has been found useful in detecting faults in different systems used in engineering and has some advantages when it comes to dealing with high dimensional and dense data. In the case of using wind turbine condition monitoring which is an aspect of using deep neural networks to detect incipient faults through the analysis of sensor data including vibration and SCADA signals has been studied. Supervised approaches such as convolutional neural networks (CNNs), recurrent models such as LSTMs have shown to be effective on labeled datasets but were limited because of the lack of labeled fault samples [10, 11]. Autoencoders or cluster-based approaches are more popular as unsupervised methods that are not dependent upon expensive and unequally balanced labeled data. Nevertheless, this attribute of deep learning models can be countered by a limited dimensionality of SCADA data, which requires the development of input feature augmentation strategies or shared data modalities.
Helbing and Ritter proposed the application of deep learning to the fault diagnosis of wind turbines, and the applications of the unsupervised learning including stacked autoencoders and supervised methods with CNNs and MLP network to analyze SCADA and vibrations records [12]. S. R. Saufi et al. proposed review of deep learning models in machinery fault detection and diagnosis, challenges including data segmentation and hyper parameter optimization and opportunities involving integration of deep architectures with shallow learning models [13]. Rahat Iqbal et al. proposed the constant need to detect and isolate faults in the industrial processes paved the way to the proposed deep learning approach to model spatial-temporal patterns in industrial processes, outperforming traditional techniques [14]. Gerrit Bode et al. proposed a fault detection method based on machine learning, trained on an experimental heat pump and did not find direct applicability to real buildings systems because of data incompatibility and labeling limitations [15]. Jan et al. proposed a distributed sensor-fault detection and diagnosis method based on SAE-SVM and EA-FDNN and they did an excellent work in terms of accurateness and efficiency in sensor fault detection at decentralized location and fault classification at a central location [16]. Sun et al. proposed a CS-DNN approach that applies the CS approach and the stacked sparse autoencoders to bear intelligent fault diagnosis with high accuracy and narrowed data dimensions [17].
2.2 Time series data imputation in power grids
The imputation of time series data in power grids is a new important focus of research as modern energy systems have grown in complexity and measurement data has become extremely susceptible to the problem of missing values due to sensor failure, communication disruptions or environmental interferences. The ARIMA (or KNN-based) imputation approaches, which are common to statistics, are not well adapted to the non-Stationarities and non-linearities of grid data, especially when it comes to very long missing blocks or sudden shifts in trends of the load. In recent years machine learning and deep learning techniques have become more popular which exploit the sense of temporal relationships and context to enhance precision. As an example, recurrent neural networks (RNNs) and long short-term memory (LSTM) models have been extensively applied to sequential prediction tasks and transformer-based self-attention mechanisms have also demonstrated the ability to capture long-range relationships in voltage or power consumption data. Nonetheless, there is often a problem of these models with heterogeneous information (e.g. integrating numerical sensor data with textual maintenance logs) or ability to react to domain-specific limitations such as physical laws that describe grid activity.
Zhang et al. proposed the topology of the grid, the correlation in the time series to build a spatio-temporal version of graphical neural network-based denoising autoencoder (STGNN-DAE) as a missing data imputation algorithm in smart grids, which has better imputation accuracy compared to state-of-the-art methods [18]. Wang et al. proposed a comparison of statistical (ARIMA, LI) and machine learning (K-NN, SVR, MLP) approaches to imputing missing values in electric power data and proved that the results of K-NN and SVR methods significantly surpassed statistics-based ones, whether over various seasonal changes or peak times [19]. Weber et al. proposed the Copy-Paste Imputation (CPI) method for energy time series, based on copying and scaling blocks of matching data to fill gaps, and this outperformed benchmark methods in pattern accuracy and energy conservation [20]. Schreiber et al. proposed use of the Makima interpolation method of missing data imputations with Smart Grids proving more efficient than KNN, Median Imputation and LOCF of managing real world substation data and high data missing rate [21]. Vasenin et al. proposed Seasonal KNN (SKNN) and Historical Data-Informed Regression Technique (H-DIRT) that imputes power demands using seasonality’s to achieve greater accuracy compared to the standard KNN that also supports nearly 50 percent missing data [22]. Razavi-Far et al. proposed a correlation clustering imputation (4CI) algorithm to diagnose power grid faults and attacks with missing data which comprised of clustering, imputation, decision-making and optimization modules to process high-dimensional PMU data and diagnose faults and attacks of power grids [23]. Fu et al. proposed a multidimensional context autoencoder model based on image methods (PConv and 2D-CNN) to fill in missing data in building energy other than conventional methods and have shown that it was effective in filling the random or continual holes [24]. Nayak et al. proposed a self-attention-based imputation model (SAITS) for missing D-PMU data in distribution grids, enhancing monitoring and protection system reliability with superior accuracy under fault conditions [25]. Javad Fattahi et al. proposed low-inertia nanogrid digital twins real-time data imputation structure, in which the technique k-NN, MissForest, and GAIN are conditionally chosen in a rolling window according to different missing rates in order to maximize synchronization control [26].
New implementation of deep learning has improved the fault detection and time series imputation in the power grids, although uncertainties remain on how to match these techniques on grid demands. There are other types of models that are better at fault detection, such as CNNs or LSTMs, which can learn intricate patterns within a labeled dataset to detect faults signal (e.g. voltage disturbance or turbine jolt). But their inabilities to use larger datasets of faults and lack of interpretability impede implementation and unsupervised methods such as autoencoders suffer in dynamic grid settings where noise and equipment changing conditions make the localisation of anomalies problematic. Transformer-based architectures with attention mechanism holds some potential in long-term dependency capture but is hindered by high computational costs and lack of similarity with physical grid dynamics. Meanwhile, imputation in time series has seen a transition in approaches to a hybrid deep learning approach. The LSTMs, GRUs and transformers with attention have all used the temporal correlations to fill in the missing values and the use of the multi-modal fusion augmentations introduces numerical sensor information with contextual information such as weather or maintenance records to increase robustness. The base models used with ensemble techniques like AttnStack are dynamically-weighted against the base model (i.e., GRIN or BRITS), to address different data gaps, but the high-dimensional data is still a challenge, as well as the real-time capability, and compliance with grid physics. The two fields have similar challenges: domain specific training data is limited, there is a lack of generalization that will work across a variety of systems, and models should be explainable to provide operators with the confidence of trust. Hybrid solutions combining physics-based rule-based models and data-driven models are recommended as future research is needed to use scalable and interpretable solutions to models to promote grid resilience.
3 Methodology
3.1 Data preparation and preprocessing
The dataset employed in this study draws from a representative power grid sample, incorporating time-series measurements of current, voltage, and power. Structured in a tabular format, it includes a timestamp column (denoting dates) alongside various feature columns, with one specific column designated as the target variable for predictive tasks.To begin, the dataset is partitioned into training, validation, and test subsets following a standard ratio of 70%:15%:15%, ensuring balanced representation across phases. Data cleaning proceeds by eliminating extraneous columns while preserving the timestamp, target, and pertinent feature columns. The selection of features hinges on a configurable parameter: settings of ‘M’ or ‘MS’ incorporate all available feature columns for multivariate analysis, whereas ‘S’ restricts input to the target column alone for univariate processing. Prior to full data ingestion, missing entries are managed through Pandas library functions, such as dropna() for removal or fillna() for interpolation, to maintain dataset integrity.
Feature engineering focuses on extracting temporal attributes from the timestamp, including year, month, day, hour, and similar components. This is typically accomplished via Pandas’ datetime handling capabilities (e.g., accessing df[‘date’].dt attributes). If the ‘timeen’ parameter is enabled (set to 1), supplementary temporal encodings—such as periodic representations—are derived, tailored to the data's frequency (for instance, hourly intervals). Independently, the target column is isolated to support supervised learning objectives. Normalization is applied using scikit-learn's StandardScaler. The scaler is fitted exclusively to the training subset (via self.scaler.fit(train_data.values)) before transforming the complete dataset (self.scaler.transform(df_data.values)). This fitted scaler is retained for subsequent inverse operations, allowing reversion to the original scale through the inverse_transform method.
Time-series data is then sliced into input sequences (denoted as seq_x, with length seq_len) and corresponding target sequences (seq_y, encompassing a label segment of length label_len and a prediction horizon of pred_len). Timestamp-derived features are analogously segmented into seq_x_mark and seq_y_mark. To prevent out-of-bounds errors, slicing adheres to predefined dataset boundaries specified by border1 and border2. Partitioning into distinct sets is governed by task-specific flags (‘train’, ‘val’, or ‘test’), which delineate appropriate data ranges via arrays of Border1s and Border2s. For efficient model training, PyTorch's DataLoader utility is utilized to encapsulate these subsets, enabling multi-threaded operations (controlled by num_workers), batched iteration (batch_size), and optional shuffling (shuffle flag). Inverse normalization, when required, leverages the stored scaler to restore data to its preprocessed form.
3.2 Design and implementation of temporal data repair model
The temporal algorithm model for missing data completion used in the model architecture is shown in Figure 1.
TimeMixer++ is a perfectly integrated layer of the Qwen2 large language model that extends its multi-scale time series application and forecasting by an up-to-date encoder-decoder scheme. By uniting those cross-variable interactions and the multi-resolution time imaging with the standard hierarchical pattern decomposition, the system based on Qwen2 robust architecture can process and infer the complex time structure. TimeMixer++ has an input projection layer whereby self-attention mechanisms and embedding layers collaborate to capture cross-variable dependencies. The self-attention mechanism pools information at the coarsest time scale whereas embedding layer converts multi-scale time series into deep ensemble representations. Conceptual multi-scale processing Convolving down sampling processes would retrieve patterns over increasingly coarser time resolutions. The most important innovation is the metamorphosis of multi-scale time series to multi-resolution time images, which supports concurrent analysis of the time and the trend structures. Of relevance here is the Fast Fourier Transform (FFT) that translates frequency components into time-image and interpretable representations. The decomposition stage uses a dual-axis attentive to separate trend and seasonal patterns. Column-axis attention removes seasonality whereas row-axis attention measures long-term trends. The patterns are then mixed hierarchically with regard to scales, that is, seasonal patterns are interpolated between fine and coarse scales, trend patterns between coarse and fine scales. Multi resolution mixing requires a weighted aggregation of the components of the frequency at each level such that the patterns of the greatest significance make significant contributions to the overall representation. The output projection uses the multi-head prediction scheme of Qwen2 that involves deploying suitable head to output specialized results at a definite scale and then aggregating the outputs by ensemble methods like weighted summation or averaging. With the ability to work well with Qwen2, the enhanced version of TimeMixer++ offers improved interpretability and prediction performance where the deep learning ability of the model is exploited to effectively manage complex and multi-scale temporal dependency. The overall algorithm process is shown in Figure 2.
To better demonstrate the flow of the proposed approach, the overall algorithm can be shown in the psudo codes below:
data = load_power_grid_data() # Load current, voltage, power time series
data = clean_data(data) # Handle missing values with dropna/fillna
features = extract_time_features(data, freq='hourly') # Year, month, etc.
data_normalized = normalize(data, scaler=StandardScaler()) # Fit on train
embeddings = project_input(train, self_attention= True) # Cross-variable deps
multi_res = downsample_convolve(embeddings) # Coarser resolutions via conv
time_images = fft_transform(multi_res) # Frequency to time-image
trends, seasons = decompose(time_images, dual_ axis_attention=True)
mixed_patterns = hierarchical_mix(trends, seasons, weights=params)
predictions = multi_head_predict(mixed_patterns, ensemble='weighted_sum')
repaired_data = impute_missing(predictions, mask_ rate) # Context-aware fill
output = inverse_normalize(repaired_data, scaler)
return output
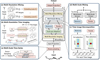 |
Fig. 1 Architecture of the proposed TimeMixer++ temporal data repair model integrated with Qwen2. The pipeline combines multi-resolution temporal imaging, trend-seasonal decomposition, and context-aware generation to impute missing values and detect anomalies in power grid time series. |
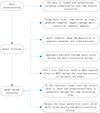 |
Fig. 2 Workflow of the hybrid anomaly detection and data repair process. Raw sensor data is preprocessed, transformed into multi-scale temporal representations, and refined through Qwen2-guided imputation before final prediction and anomaly scoring. |
3.3 Test and verification
Checks of the model strength Robustness of a model is how a model behaves on negative conditions like noise, outliers and on shifts in distribution. Robust testing forms an essential way of determining the reliability and sustainability of a model in the real-world situations. Noise injection: will introduce a random noise (e.g. gaussian noise, white noise) or a time offset the input data to test how the model will react. Distribution bias: Evaluation of the work of one of the models when the training and testing data sets are not similar. As an example, the sets of training and testing are extracted at different time points or even data sources. Outlier injection: Inject outliers into the normal data and monitor whether the model could effectively deal with them.
4 Experimental study
4.1 Experimental setup
The proposed organization of the experimental setup can take advantage of the high-performance computing resources in terms of the training and testing of the suggested hybrid architecture of deep learning. As part of the hardware specifications, it features an NVIDIA RTX 4090 GPU marketed as a computer graphics accelerator with 24GB GDDR6X memory with 16384 CUDA cores and is suitable enough to crunch numerous kinds of time series data and high-dimensional model functions. It is matched with an Intel Core i9-13900K processor that has 24 cores and a 5.8GHz base boost frequency that guarantees effective parallel processing of data preprocessing and model inference requests. It has 64GB DDR5 RAM at 6000MHz to facilitate high throughput data transfer rates and a 2TB NVMe SSD that can cache and store model checkpoints in the event of iterative models training.
Otherwise, on the software aspect, the environment implements Python 3.10.12 and CUDA 12.1 to accelerate the GPUs. The most famous deep learning framework develops PyTorch 2.0.1 and is exploited because it is easy to implement custom-designed models such as the Qwen2-Transformer hybrid model, and the adversarial training components are integrated with TensorFlow 2.12.0, a similar widespread framework except in terms of training procedures. Other libraries used are NumPy 1.24, Pandas 2.0.3, Scikit-learn 1.3.0, Matplotlib 3.7.1, and Scikit-learn 1.3.0 to encode and decode information, data manipulation, preprocessing and evaluation metrics, and visualization respectively.
The dataset used in this study was collected from the actual power grid in the southwest part of China. The data was collected for three months. Figures 3–5 show the power grid time-series dataset is obtained by continuously recording current, voltage, and power time-series datasets. The features in the dataset include: Active Demand Load (ADL), Balanced Distribution Load (BDL), Critical Distribution Load (CDL), Active Distribution Voltage (ADY), and Balanced Distribution Voltage (BDY).
The ADL (blue) is highly volatile, fluctuating between −1 and 1, with frequent shifts in direction and no clear long-term trend, showing random variations. Certain index points exhibit extreme changes. The BDL (green) is less volatile, ranging from −0.5 to 0.5, with steady oscillations and lower amplitude shifts. Its fluctuations are more stable, lacking long-term trends but displaying low volatility. The CDL (red) is the most volatile, ranging from −2 to 2, with sharp peaks and frequent sign reversals. Like ADL, it has high fluctuation frequency and no sustained trend, but its amplitude is significantly larger. Overall, CDL’s volatility exceeds BDL’s and matches ADL’s in frequency while having a wider range. Both ADL and CDL show high variability, whereas BDL remains relatively stable. None exhibit long-term directional tendencies, with ADL and CDL being more unpredictable due to their extreme fluctuations.
The ADY blue curve has extreme oscillations, where the voltages read 100 200 most of the time and it might go up to more than 250. The extreme rate of fluctuation can be an indication of high-frequency load changes or the external interference within the system and so drastic changes of voltage occur. Such a trait can serve as a sign of ineffective stability of the ADY voltage, or that it is highly strained at some instances. The amplitude of the BDY green curve is not large, and the value of the voltage reaches about 100 most of the time but sometimes it may exceed 200. This steady variation represents that BDY voltage is very stable and the system operates normally during the majority of time. Sometimes there can be spikes which can be pointing at certain temporary abnormal conditions, like temporary change in load or external disturbances. The amplitude of fluctuation of the CDY in the red curve falls between ADY and BDY with a greater realization that the numerical value of the voltage range found to be between 50 and 100 but at times reaching more than 150. This moderate voltage variation signifies that the CDY voltage is more likely to be constant throughout most of the time but in some cases it is influenced by some factors resulting in a change or variation in voltage which is temporary. This feature can be an indication of dynamic loads or steps of adjustment procedures existing in the system.
The blue line of AZWG depicts the characteristic of sure periodic variation in which values constantly change between 1 and −1, and with big amplitude. The frequency of fluctuation of the curve is quite high that there is a normal oscillation tendency and it could display certain regular characteristics of variable period. The green curve of BZWG ranges between −1.0 and 0.0; also, the vertical lines are distributed quite evenly in the middle range. Also, like AZWG, power values of BZWG show the characteristics of discrete change at index points, but the general trend is comparatively stable with no considerable rise or fall. Vertical lines of the CZWG red curve are distributed homogeneously. As to the power values of CZWG, also like AZWG and BZWG, it shows discrete fluctuation at various index points, however, in total fluctuation ratio is not too large, and the power values are at a relatively low level.
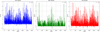 |
Fig. 3 Sample current measurements from the power grid dataset. The three channels (ADL, BDL, CDL) show varying levels of volatility, with CDL exhibiting the highest amplitude fluctuations and ADL showing frequent directional changes, while BDL remains relatively stable. |
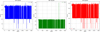 |
Fig. 4 Voltage time series from three grid nodes (ADY, BDY, CDY). ADY displays large, abrupt swings (often exceeding 250 V), indicating potential instability, whereas BDY shows milder variations centered around 100 V, reflecting more stable operating conditions. |
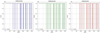 |
Fig. 5 Power consumption profiles over time across different feeders. The data reveals complex temporal patterns, including peak loads and intermittent drops, characteristic of real-world smart grid operations with renewable integration and variable demand. |
4.2 Evaluation metrics
This study evaluates the proposed method using two primary metrics: Mean Absolute Error (MAE) and Mean Squared Error (MSE). MAE quantifies the average absolute difference between predicted and true values, calculated as:
 (1)
(1)
while MSE measures the squared differences, defined as:
 (2)
(2)
These metrics provide a straightforward assessment of prediction accuracy by emphasizing the magnitude of errors without normalization or percentage scaling.
4.3 Baseline models
As a way of establishing the effectiveness of the proposed method we measure it with three baseline models: LSTM, GRU, and Transformer. All baseline models were implemented using PyTorch and trained on the same preprocessed dataset as our proposed method to ensure a fair comparison. LSTM used two layers with 128 hidden units, a dropout rate of 0.2, and was trained for up to 50 epochs with early stopping (patience=10) using the Adam optimizer (learning rate = 1e–3, batch size = 64). GRU followed an identical configuration. The Transformer baseline adopted 4 encoder layers, 8 attention heads, a hidden dimension of 256, and positional encoding.
The comparison is dedicated to the operative capacity of these models to minimize the MAE and MSE of the grid time-series tasks to provide a definite picture of the suggested hybrid methodology in relation to the traditional ones in the context of the imperfection reduction and reliability in the case of data errors.
5 Experimental results
5.1 Experimental results of time-series data repair
After identifying missing values, the TIMEMixer++algorithm is used to achieve data repair. The data set used in the following table shows the data repair errors at mask_rates of {0.1, 0.2, 0.3, 0.4}. Among them, MAE is the mean absolute error, and MSE is the mean square error. The results are shown in Table 1.
Comparison of error metrics of repair algorithms at different mask rates.
5.1.1 Trend predictive power
Having analyzed the test result chart and the error table, it is possible to note that the model possesses some effectiveness in forecasting the overall tendencies of current, voltage and power at various mask_rates. When examining the analogous results of the tests, i.e. in the graph of test results containing four values of mask_rates (0.1, 0.2, 0.3, 0.4), the values predicted are relatively close to the true ones in relation to the overall trend. The results are shown in Figures 6–9. E.g. in the prediction of current and voltage, predicted curves of most regions tend to follow the trend of the true value curve; Power prediction can also follow the trend in the curve of most regions. This shows that the model possesses a few learning and fit capabilities and can be able to identify the fundamental trends of data.
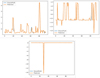 |
Fig. 6 Test results of current, voltage, and power at mask_rate of 0.1. |
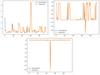 |
Fig. 7 Test results of current, voltage, and power at mask_rate of 0.2. |
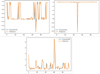 |
Fig. 8 Test results of current, voltage, and power at mask_rate of 0.3. |
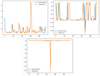 |
Fig. 9 Test results of current, voltage, and power at mask_rate of 0.4. |
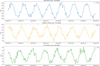 |
Fig. 10 Electricity transformer temperature dataset. |
5.1.2 Indicator of error performance
Error table goes further to quantify predictive accuracy of the model using the MAE (Mean Absolute Error) and MSE (Mean Squared Error). At mask_rate 0.1 the current is 0.567 and 0.927 MAE and MSE respectively; the voltage is 0.637 and 0.661 MAE and MSE respectively; the power is 0.263 and 1.054 MAE and MSE respectively. As mask_rate increases, the overall error is not infinite when mask_rate reaches the level of 0.3, and the trend of various error indicators remained overall upward at a low level, which is to say that the model can have a relatively stable predictive performance regardless of the level of data loss, which also demonstrates the effectiveness of the model.
We evaluated the performance of various models in reconstructing missing current data under increasing levels of data loss, simulated by masking rates from 0.1 to 0.4. As shown in Table 2, all models exhibit a slight increase in error with higher mask rates, indicating degraded performance under greater data incompleteness. LSTM and GRU show similar trends, with GRU slightly outperforming LSTM at higher mask rates due to its simplified gating mechanism. The Transformer model maintains stable performance across conditions, leveraging self-attention to capture long-range dependencies effectively. However, our proposed TimeMixer++ consistently achieves the lowest MAE and MSE across all mask rates, demonstrating superior robustness and modeling capability. Notably, it reduces MAE by up to 11% compared to the best baseline (Transformer) at a 0.4 mask rate. This improvement stems from TimeMixer++’s multi-scale temporal decomposition and enhanced feature mixing, which enables more accurate reconstruction even when significant portions of the time series are missing. These results confirm the effectiveness of our method in real-world power grid scenarios where data quality is often compromised.
Comparison of error metrics on current data modelling betweens different algorithms.
5.2 Application of ETT time series dataset in power grid transformer fault detection and repair
A deep learning model with advanced features of fault detection and intelligent repair of power grids was developed using the ETT (Electricity Transformer Temperature) dataset due to the high-density resolution data it provided with transformer oil temperature and transformer oil load. The framework combines the preprocessing methods (wavelet denoising and missing value imputation), time series analysis (multi-modal feature fusion), and hybrid model of Anomaly prediction based on Qwen2 with Transformer architecture. The aim was to help enhance the precision of oil temperature prediction and identify thermo-anomalies that point at degradation of the insulation, and dispatch the maintenance more efficiently.
The ETT dataset has been subdivided into training (12 months), validation (4 months), and testing subsets (4 months) of the variants of the ETTh1/ETTh2 sampled with an hourly granularity. Wavelet transform was done as a preprocessing to diminish noise and Qwen2 autoregression to impute missing values. To perform feature engineering, grid load data (e.g. HUFL, MUFL, LUFL) and ambient variables (e.g. weather) were fused by weighted averaging. The hybrid architecture took the sequence encoding of Qwen2 and set it with a Transformer decoder that was used to make long-term forecasting, whereas adversarial training increases robustness. The text generation and graph neural networks made by Qwen2 were used to implement faulty localization and repair planning, which can be used to focus on the important transformers. The dataset is shown in Figure 10.
Load forecasting, in the case of power grid management, is key in ensuring that the system remains steady. The example demonstrates the work of the proposed hybrid framework of Qwen2 trained on the ETT time-series dataset and using it to forecast utility load under different situations. The used evaluation metrics are Mean Absolute Error (MAE) and Mean Squared Error (MSE) where we are measuring the accuracy of the model in the high-level, medium levels and low levels.
The Qwen2-based framework is also very adaptive to various levels of loads. In high utility load the model has a MAE which is 1.12 units and an MSE of 1.32 units 2, meaning that the predictions will produce little error even at the high utility load. The MAE reduces further to 0.89 units under medium utility loads, and a value of MSE of 0.94 units2, indicating a high score in terms of forecasting. The model performs very well under the low utility load with an MAE of 0.65 units and an MSE of 0.47 units 2, to support a well-controlled situation of low demand. The results indicate the framework can be robust to dynamic load patterns through multi-modal feature fusion (e.g. use of weather and historical load data) and adversarial training to accommodate noisy, or incomplete data inputs.
Table 3 presents the summarized results of the work of the model where the values of MAE and MSE are directly the franchise of the conditions under which the dataset itself is loaded. that the steady decrease of the error metrics throughout all the scenarios confirms the strength of Qwen2 context-aware reasoning and its hybrid architecture in extracting temporal dependencies and contextual relations. This discussion validates the framework in its capacity to make changes in the grid reliability through the capability to forecast the loads accurately and adaptively when faced with various loads requirements.
Comparison results in the ett dataset.
6 Discussion
The proposed TimeMixer++-Qwen2 framework demonstrates strong performance in imputing missing values and detecting anomalies in real-world power grid time series. By fusing multi-modal contextual information—such as voltage readings, weather conditions, and temporal patterns—with a novel multi-scale temporal architecture, our method achieves lower reconstruction errors (MAE and MSE) compared to traditional approaches like ARIMA, LSTM, and GAN-based models, especially under high data loss scenarios. Moreover, the integration of Qwen2 enables context-aware generation of realistic data segments, supporting more stable downstream fault prediction and proactive maintenance strategies.
The hybrid design balances interpretability and performance: TimeMixer++ captures the physical and temporal dynamics of the grid, while Qwen2 leverages its pre-trained reasoning capabilities to fill gaps in a semantically consistent manner—without requiring fine-tuning. This makes the system both scalable and adaptable to operational settings where labeled anomaly data is scarce.
Our approach has several practical constraints. While anomaly detection is performed in an unsupervised manner using reconstruction residuals, its evaluation relies on known fault events, which may be incomplete or inconsistently logged in real-world systems. Additionally, the current pipeline involves moderate computational overhead due to multi-resolution processing and generative inference with Qwen2, which could hinder deployment in latency-sensitive or edge-based grid monitoring scenarios without further optimization (e.g., quantization or distillation). Our experiments were conducted on data from the Yunnan Power Grid, and although the architecture is designed to be general, its performance may vary across grid topologies with different scales, levels of renewable integration, or sensor coverage. Finally, the method assumes that auxiliary data—such as weather or maintenance logs—is available and temporally aligned with sensor readings, an assumption that may not hold in legacy or partially instrumented infrastructure.
Despite these limitations, the framework represents a meaningful step toward intelligent, data-driven grid management. Its ability to operate without fine-tuning, handle high missingness rates, and incorporate real-world context makes it well-suited for near-term adoption in modernization efforts. Future work will focus on reducing computational demands, improving cross-grid generalization through transfer learning, and incorporating physics-based constraints to enhance reliability in data-scarce or asynchronous environments.
7 Conclusion
This paper describes a new deep learning model, TIMEMixer++ that achieves repair and predicts power grid time series data using the large language model, Qwen2, with Transformer structure. The efficiency of the proposed method is proven by experimental results obtained on real world datasets. As an example, TIMEMixer++, given a data missing rate of 10 per cent (mask_rate=0.1), yields a Mean Absolute Error (MAE) of 0.567, 0.637, and 0.263 on current data, voltage and power, respectively, which outperform the conventional models such as ARIMA and GANs. The model has good robustness: even in high utility (1.12), medium (0.89) and low (0.65) load condition, the model has low MAE values which have proved that the adaptability of the model to dynamic grid conditions. Context-aware imputation is made possible by the capacity of the model to support multi-modal input streams (e.g., weather, sensor data and maintenance logs).
This is the strength of the work that consists in the original application of the multi-scale temporal analysis on Qwen2 and the adversarial training, which leads to increased accuracy and interpretability. TIMEMixer++ improves on the conventional methods (e.g., use of physical constraints (e.g., voltage correlations), temporal dependencies) in addressing missing data and noise. The computational requirements of hybrid architecture though, especially during training, point to the optimized use of hardware resources (e.g. high-performance GPUs).
The future research will be based on computational efficiency in terms of lightweight models, and experimenting with real-time deployment methods of large-scale grids. Also, implementing physics-based principles peculiar to the field of interest may further enhance the veracity of predictions. It can also be seen that the methodology can be expanded to other energy systems, whether that is forecasting renewable energy or analyzing the stability of microgrids. With the ability to establish a computationally tractable correlation between data-driven intelligence and grid-specific constraints, the research can have capacity to improve the resilience and sustainability of the current power infrastructure.
Funding
This research received no external funding.
Conflicts of interest
The authors declare that they have no conflict of interest.
Data availability statement
The data that support the findings of this study are available from the corresponding author upon request.
Author contribution statement
Contribution: Li Tang: Conceptualization, Methodology, Software, Validation, Formal Analysis, Investigation, Data Curation, Writing – Original Draft, Visualization. Wenxiang Yang: Methodology, Software, Validation, Investigation, Writing – Original Draft, Writing – Review & Editing. Guangqian Lu: Validation, Investigation, Resources, Data Curation, Writing – Review & Editing. Guanyu Zhang: Supervision, Project Administration, Funding Acquisition, Writing – Review & Editing.
Li Tang received the M.S. degree in Software Engineering from Guizhou University, Guiyang, China. She is currently an Engineer and serves as the Data Quality Management Specialist in the Data Resource Center, Information Center of Yunnan Power Grid Co., Ltd., Kunming, China. Her research interests focus on data governance and data quality management. Email: This email address is being protected from spambots. You need JavaScript enabled to view it.
Wenxiang Yang received the M.S. degree in Electronic Engineering from New York University, USA. He is currently a Senior Engineer and serves as the Data R&D Management Specialist at the Data Resource Center, Information Center of Yunnan Power Grid Co., Ltd., Kunming, China. His research focuses on big data technologies and data management. Email: This email address is being protected from spambots. You need JavaScript enabled to view it.
Guangqian Lu serves as a Data Planning Specialist in the Data Resources Center at Yunnan Power Grid Co., Ltd., Information Center. He holds the title of Engineer and is dedicated to data planning and infrastructure development. Email: This email address is being protected from spambots. You need JavaScript enabled to view it.
Guanyu Zhang received the M.S. degree in E-Commerce from The Chinese University of Hong Kong. He is currently an Engineer and serves as the Data Operations Management Specialist at the Data Resource Center, Information Center of Yunnan Power Grid Co., Ltd., Kunming, China. His research focuses on data operations and big data technologies. Email: This email address is being protected from spambots. You need JavaScript enabled to view it.
References
- R. Bayindir, I. Colak, G. Fulli, K. Demirtas, Smart grid technologies and applications, Renew. Sustain. Energy Rev. 66, 499–516 (2016) [Google Scholar]
- H. Ge, S. Asgarpoor, Reliability and maintainability improvement of substations with aging infrastructure, IEEE Trans. Power Delivery, 27, 1868–1876 (2012) [Google Scholar]
- Y. Chen, M. Rao, K. Feng, M.J. Zuo, Physics-informed LSTM hyperparameters selection for gearbox fault detection, Mech. Syst. Signal Process. 171, 108907 (2022) [Google Scholar]
- C. Chen, T. Wang, K. Lu, Y. Liu, L. Cheng, Compact convolutional transformers-generative adversarial network for compound fault diagnosis of industrial robot, Eng. Appl. Artif. Intell. 138, 109315 (2024) [Google Scholar]
- T. Wang, W. Xu, C. Chen, Z. Wang, Z. Chen, Progressive hypergraph structure learning for fault diagnosis of industrial robots, IEEE Trans. Instrum. Meas. (2025) [Google Scholar]
- M. Massaoudi, H. Abu-Rub, S.S. Refaat, I. Chihi, F.S. Oueslati, Deep learning in smart grid technology: a review of recent advancements and future prospects, IEEE Access, 9, 54558–54578 (2021) [Google Scholar]
- S.M. Ribeiro, C. Castro, Missing data in time series: a review of imputation methods and case study, Learn. Nonlinear Model, 20, 31–46 (2022) [Google Scholar]
- S. Wang et al., Timemixer++: a general time series pattern machine for universal predictive analysis, arXiv preprint arXiv:2410.16032, 2024 [Google Scholar]
- Q. Team, Qwen2 technical report, arXiv preprint arXiv:2407.10671, 2, (2024) [Google Scholar]
- Y. Xiao, H. Shao, S. Han, Z. Huo, J. Wan, Novel Joint Transfer Network for Unsupervised Bearing Fault Diagnosis from Simulation Domain to Experimental Domain, IEEE/ASME Transactions on Mechatronics, 2022 [Google Scholar]
- K. Lu, C. Chen, T. Wang, L. Cheng, J. Qin, Fault diagnosis of industrial robot based on dual-module attention convolutional neural network, Auton. Intell. Syst. 2, 1–12 (2022) [Google Scholar]
- G. Helbing, M. Ritter, Deep learning for fault detection in wind turbines, Renew. Sustain. Energy Rev. 98, 189–198 (2018) [Google Scholar]
- S.R. Saufi, Z.A.B. Ahmad, M.S. Leong, M.H. Lim, Challenges and opportunities of deep learning models for machinery fault detection and diagnosis: a review, IEEE Access, 7, 122644–122662 (2019) [CrossRef] [Google Scholar]
- R. Iqbal, T. Maniak, F. Doctor, C. Karyotis, Fault detection and isolation in industrial processes using deep learning approaches, IEEE Trans. Ind. Inform. 15, 3077–3084 (2019) [Google Scholar]
- G. Bode, S. Thul, M. Baranski, D. Müller, Real-world application of machine-learning-based fault detection trained with experimental data, Energy, 198, 117323 (2020) [Google Scholar]
- S.U. Jan, Y.D. Lee, I.S. Koo, A distributed sensor-fault detection and diagnosis framework using machine learning, Inform. Sci. 547, 777–796 (2021) [Google Scholar]
- J. Sun, C. Yan, J. Wen, Intelligent bearing fault diagnosis method combining compressed data acquisition and deep learning, IEEE Trans. Instrum. Meas. 67, 185–195 (2017) [Google Scholar]
- C. Zhang, S.R. Kuppannagari, R. Kannan, V.K. Prasanna, Generative adversarial network for synthetic time series data generation in smart grids, in: 2018 IEEE International Conference on Communications, Control, and Computing Technologies for Smart Grids (SmartGridComm), IEEE, 2018, pp. 1–6 [Google Scholar]
- M.-C. Wang, C.-F. Tsai, W.-C. Lin, Towards missing electric power data imputation for energy management systems, Exp. Syst. Appl. 174, 114743 (2021) [Google Scholar]
- M. Weber, M. Turowski, H.K. Çakmak, R. Mikut, U. Kühnapfel, V. Hagenmeyer, Data-driven copy-paste imputation for energy time series, IEEE Trans. Smart Grid, 12, 5409–5419 (2021) [Google Scholar]
- J.F. Schreiber, A. Sausen, M. De Campos, P.S. Sausen, M.T.D.S. Ferreira Filho, Data imputation techniques applied to the smart grids environment, IEEE Access, 11, 31931–31940 (2023) [Google Scholar]
- D. Vasenin, M. Pasetti, D. Astolfi, N. Savvin, S. Rinaldi, A. Berizzi, Incorporating Seasonal Features in Data Imputation Methods for Power Demand Time Series, IEEE Access, 2024 [Google Scholar]
- R. Razavi-Far, M. Farajzadeh-Zanjani, M. Saif, S. Chakrabarti, Correlation clustering imputation for diagnosing attacks and faults with missing power grid data, IEEE Trans. Smart Grid, 11, 1453–1464 (2019) [Google Scholar]
- C. Fu, M. Quintana, Z. Nagy, C. Miller, Filling time-series gaps using image techniques: Multidimensional context autoencoder approach for building energy data imputation, Appl. Thermal Eng. 236, 121545 (2024) [Google Scholar]
- S. Nayak et al., Data imputation using self attention based model for enhancing distribution grid monitoring and protection systems, IEEE Trans. Instrum. Meas. 73, 1–11 (2024) [Google Scholar]
- J. Fattahi, Real-time data imputation for low inertia nanogrid digital twins, in: 2024 IEEE 10th World Forum on Internet of Things (WF-IoT), IEEE, 2024, pp. 654–659 [Google Scholar]
Cite this article as: L. Tang, W. Yang, G. Lu, G. Zhang, Deep learning-driven intelligent data anomaly detection and repair technology for power grids, Mechanics & Industry 27, 13 (2026), https://doi.org/10.1051/meca/2026007
All Tables
Comparison of error metrics on current data modelling betweens different algorithms.
All Figures
|
Fig. 1 Architecture of the proposed TimeMixer++ temporal data repair model integrated with Qwen2. The pipeline combines multi-resolution temporal imaging, trend-seasonal decomposition, and context-aware generation to impute missing values and detect anomalies in power grid time series. |
| In the text | |
|
Fig. 2 Workflow of the hybrid anomaly detection and data repair process. Raw sensor data is preprocessed, transformed into multi-scale temporal representations, and refined through Qwen2-guided imputation before final prediction and anomaly scoring. |
| In the text | |
|
Fig. 3 Sample current measurements from the power grid dataset. The three channels (ADL, BDL, CDL) show varying levels of volatility, with CDL exhibiting the highest amplitude fluctuations and ADL showing frequent directional changes, while BDL remains relatively stable. |
| In the text | |
|
Fig. 4 Voltage time series from three grid nodes (ADY, BDY, CDY). ADY displays large, abrupt swings (often exceeding 250 V), indicating potential instability, whereas BDY shows milder variations centered around 100 V, reflecting more stable operating conditions. |
| In the text | |
|
Fig. 5 Power consumption profiles over time across different feeders. The data reveals complex temporal patterns, including peak loads and intermittent drops, characteristic of real-world smart grid operations with renewable integration and variable demand. |
| In the text | |
|
Fig. 6 Test results of current, voltage, and power at mask_rate of 0.1. |
| In the text | |
|
Fig. 7 Test results of current, voltage, and power at mask_rate of 0.2. |
| In the text | |
|
Fig. 8 Test results of current, voltage, and power at mask_rate of 0.3. |
| In the text | |
|
Fig. 9 Test results of current, voltage, and power at mask_rate of 0.4. |
| In the text | |
|
Fig. 10 Electricity transformer temperature dataset. |
| In the text | |
Current usage metrics show cumulative count of Article Views (full-text article views including HTML views, PDF and ePub downloads, according to the available data) and Abstracts Views on Vision4Press platform.
Data correspond to usage on the plateform after 2015. The current usage metrics is available 48-96 hours after online publication and is updated daily on week days.
Initial download of the metrics may take a while.