| Issue |
Mechanics & Industry
Volume 27, 2026
Overview of recent advances in research for next generation in Mechanical Engineering
|
|
|---|---|---|
| Article Number | 25 | |
| Number of page(s) | 11 | |
| DOI | https://doi.org/10.1051/meca/2026016 | |
| Published online | 01 June 2026 | |
Original Article
Fractional model for the characterization of the linear viscoelastic behavior of thermoplastic polymer
Institut National des Sciences Appliquées Centre Val de Loire, Laboratoire de Mécanique Gabriel Lamé EA 7494, 3 Rue de la Chocolaterie, 41000 Blois, France
* e-mail: This email address is being protected from spambots. You need JavaScript enabled to view it.
Received:
25
November
2025
Accepted:
22
March
2026
Abstract
This study proposes fractional models to describe the linear viscoelastic behavior of polymethyl methacrylate over a wide range of frequencies and temperatures. The objective of this work is to investigate the efficiency of the fractional model in the identification of the viscoelasticity of the polymer. The experimental data were obtained based on the dynamic mechanical analysis over a limited frequency range at different temperatures. The time–temperature superposition principle was utilized to extend the experimental data across an expanded frequency range. The validity range of this approach was confirmed through the Cole–Cole plot. A master curve for polymethyl methacrylate at a reference temperature was constructed by shifting the dynamic mechanical analysis curves acquired at different temperatures along the frequency axis. The horizontal shift factors were efficiently fitted using the Williams–Landel–Ferry equation. The experimental data, which failed to affirm the time–temperature superposition principle, were precisely characterized using the fractional element model. The master curve was accurately characterized by employing the fractional Zener model. A good agreement between the numerical models and experimental data was achieved. The efficiency of these models was validated by error estimation. The superiority of the fractional models was substantiated through comparative analysis with the integer models. The fractional model was confirmed to be accurate for the prediction of the viscoelastic behavior of polymethyl methacrylate. The Williams–Landel–Ferry equation can be incorporated into the fractional models to address the temperature-dependent viscoelastic properties of the material.
Key words: Fractional model / Williams–Landel–Ferry equation / dynamic mechanical analysis / viscoelasticity / thermoplastic polymer
© R. Dang et al., Published by EDP Sciences, 2026
 This is an Open Access article distributed under the terms of the Creative Commons Attribution License (https://creativecommons.org/licenses/by/4.0), which permits unrestricted use, distribution, and reproduction in any medium, provided the original work is properly cited.
1 Introduction
Thermoplastic polymers, such as polymethyl methacrylate (PMMA), are widely employed in mechanical engineering due to their low density, processability, and excellent mechanical properties [1]. Compared with metals, these materials exhibit distinct viscoelastic characteristics in their mechanical response. Viscoelasticity can be characterized by a complex modulus, which consists of a storage modulus, representing the elastic energy storage, and a loss modulus, reflecting the energy dissipation [2]. The temperature and frequency significantly influence their physical and mechanical properties [3]. It is necessary to propose an effective constitutive behavior law to accurately describe the inherent viscoelastic properties. The resulting models play a critical role in the vibration analysis of viscoelastic structures [4–7].
Mahieux and Reifsnider [8] attributed the evolution of the polymer mechanical properties with temperature to the microscopic failure of secondary bonds, where the probability of bond breakage can be represented by Weibull statistics. They established a robust model based on this statistical approach to describe the storage modulus from the glassy to rubbery state. Richeton et al. [9] extended this model to consider the effect of frequency on the storage modulus. The unified model was demonstrated to accurately describe the storage modulus with frequency over a vast temperature range. Matadi Boumbimba et al. [10] continued to improve this model for predicting the storage modulus of amorphous polymers to polymer/organoclay nanocomposites. These studies confirmed the frequency dependence of the mechanical properties of the thermoplastic polymers. The current research focuses on characterizing the viscoelastic behavior over a wide frequency range and establishing a comprehensive characterization of both storage and loss moduli.
Over the past decades, classical integer and fractional models have been constructed to characterize the viscoelastic behavior of materials. These models are essentially phenomenological to describe the macroscopic stress-strain relationships through differential equations [11]. As shown in Figure 1, integer models consist of springs and dashpots connected in series or parallel [12]. The spring serves as the elastic component in accordance with Hooke’s law, whereas the dashpot embodies the viscous element conforming to Newton’s law [13,14]. Integer models usually require a large number of viscoelastic elements to achieve high accuracy in characterizing complex viscoelastic responses [15]. This requirement greatly increases the inaccuracy of parameter identification and the difficulty of clarifying the physical meaning of the model. The spring-pot with a fractional derivative has been developed in viscoelastic modeling as a generalization of the spring and dashpot. The fractional order of the viscoelastic element is adjustable within the range of (0, 1), allowing a continuous transition between purely elastic and purely viscous behaviors. Su et al. [16] verified this physical meaning of the fractional order by establishing the equivalent viscoelasticity between the fractional and integer models. Fractional models are derived by substituting the dashpot in integer models with a spring-pot [17].
In recent years, fractional models have become a powerful tool for the study of the viscoelastic behavior of polymers. Sun et al. [18] compared the performance of fractional Maxwell, Zener, and Burgers models with their corresponding integer models. The fractional models more accurately described the creep behavior of polymers. Hernández-Jiménez et al. [19] utilized the fractional Maxwell model to investigate the stress relaxation behavior of PMMA and conducted a comparative analysis with the conventional integer Maxwell model. The fractional Maxwell model provided a superior fit to the stress and strain response curves of PMMA. Cai et al. [17] proposed both integer and fractional models to characterize the creep behavior of PMMA. The fractional model required fewer parameters compared with the integer model. Ikeda et al. [20] accurately described the creep response of PMMA at different temperatures by employing a three-element fractional differential viscoelastic model with fewer parameters. The capability of fractional models to efficiently characterize the viscoelastic properties of PMMA has been demonstrated. These studies on PMMA demonstrate the advantages of fractional models in the time domain. The application of fractional models within the frequency domain remains underdeveloped.
Frequency-domain analysis enables a comprehensive understanding of the viscoelastic characteristics of polymers through the integration of dynamic mechanical analysis (DMA) and the time–temperature superposition principle (TTSP). DMA simultaneously measures the storage and loss moduli of materials over a limited frequency and temperature range [21]. TTSP assumes that the effects of temperature and frequency scale on viscoelastic properties are equivalent [22]. This principle is utilized to broaden the frequency spectrum by shifting DMA curves obtained at various temperatures along the frequency axis [23]. Mazurchevici et al. [24] employed DMA to investigate the viscoelastic properties of polymers at different temperatures in the frequency domain. The storage and loss moduli of the polymers were successfully obtained, which reflected the elastic and viscous properties of the material, respectively. Ionita et al. [25] combined DMA with TTSP to investigate the viscoelastic properties of polyurethane on a wide range of frequencies. The master curves of moduli were generated at a reference temperature, which extended over several decades of frequency beyond the experimental limits. The shift factors were accurately characterized using the temperature-dependent Williams–Landel–Ferry (WLF) equation. Mahieux and Reifsnider [8] emphasized that TTSP was used as an important extension to explore the temperature-dependent properties of thermoplastic polymers. Richeton et al. [9] and Matadi Boumbimba et al. [10] integrated the WLF equation into their temperature-dependent model to describe the frequency dependency. The WLF equation is an efficient tool for establishing frequency–temperature equivalence. The present work accurately characterizes the viscoelastic behavior of PMMA based on the experimental data and employs the WLF model based on TTSP to construct master curves over a wide frequency range. Li and Xiao [26] constructed a master curve of a polymer using DMA data combined with the TTSP and employed the fractional Zener model to accurately describe its evolution. Pawlak and Denisiewicz [27] demonstrated that the same model could successfully fit the storage modulus of polyurethane across a broad frequency domain. A thorough investigation into the frequency-dependent viscoelastic model of PMMA is necessary. The advantages of the fractional model need to be clarified compared to the integer models in the frequency domain.
In this study, fractional models are proposed to characterize the linear viscoelastic behavior of PMMA. Its applicability over a wide range of frequencies and temperatures is investigated using DMA experimental data with TTSP. A comparative analysis is conducted to evaluate the advantages of these models over the integer models. The paper is structured as follows : Section 2 presents the experimental method, the integer and fractional viscoelastic models, the TTSP, and the procedure for parameter identification. Section 3 presents the results and discussion. Section 4 provides the concluding remarks.
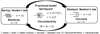 |
Fig. 1 Schematic of viscoelastic constitutive elements. |
2 Materials and methods
The thermoplastic polymer PMMA was chosen for analysis in this study. DMA and TTSP were utilized to experimentally characterize the viscoelastic behavior of PMMA. Fractional viscoelastic constitutive models were subsequently proposed to describe the viscoelastic properties and were compared with conventional integer models.
2.1 Experimental setup of DMA
PMMA was fabricated into cylindrical specimens with a diameter of 4 mm and a length of 12 mm, as shown in Figure 2. Specimen preparation was critical to ensure the accuracy of the experimental tests. The non-parallel surfaces resulted in uneven fixture contact and affected measurement results. The upper and lower surfaces of the PMMA specimens were individually polished using precision grinding equipment to ensure flatness. The prepared specimens demonstrated smooth and parallel end faces through measurement. They were required to be precisely aligned with the central axis of a fixture to ensure accurate measurements.
DMA tests were conducted according to the ASTM D5024-15 standard in compression mode to characterize the viscoelastic response of PMMA [28]. Figure 3 shows the experimental setup employed for DMA tests. The RSA-G2 compression fixture, equipped with upper and lower circular plates each having a diameter of 8 mm, is utilized to secure the specimen. The linear motor applies sinusoidal loads of up to 500 N or displacements ranging from ±0.0005 to ±6.5 mm to the specimen with high precision. The displacement sensor offers a resolution of 1 nm, facilitating precise control and measurement of both small and large deformations. The force sensor possesses a resolution of 0.006 N and is capable of measuring forces within the range of 0.2 to 500 N. The operating frequency can be adjusted from 0.01 to 100 Hz. The forced convection oven is used for thermal control over a temperature range of −150 to 600 °C. The DMA tests are controlled using WinTest software on a personal computer. The specimen geometry and the displacement amplitude are predefined in the software. The PCI electronics box performs signal conditioning, amplification, and conversion of the sensor outputs to acquire high-precision data. The viscoelastic parameters are computed based on the predefined parameters and the measured response, and they are collected in the Trio software.
Table 1 lists the experimental parameters used in the DMA tests. Strain amplitude sweep tests were first conducted at higher temperatures, ranging from 110 to 160 °C, to ensure that PMMA remained within the linear viscoelastic region. The strain amplitude was gradually increased from 0.01% to 0.8%, while the frequency was maintained at 10 Hz. Multifrequency temperature sweep tests were performed at a strain amplitude within the linear viscoelastic region. The frequency was varied logarithmically from 10 to 100 Hz across 16 frequency points. The temperature was increased from 20 to 160 °C with an interval of 5 °C. The heating rate was 10 °C/min. A soak time of 4 min was applied to ensure that the specimen reached the desired test temperature. The DMA test results truly reflected the intrinsic properties of PMMA because the viscoelastic response of PMMA was independent of the magnitude of deformation [29,30].
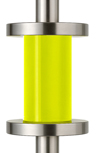 |
Fig. 2 Configurations of PMMA specimen. |
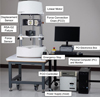 |
Fig. 3 ElectroForce 3200 Series III test instruments. |
Parameter setting for DMA tests on PMMA.
2.2 Frequency and temperature dependent viscoelastic models
Integer and fractional viscoelastic models were employed to describe the viscoelastic behavior of PMMA. Figure 4 illustrates three fundamental integer viscoelastic models: the Maxwell model, consisting of a spring and a dashpot in series; the Kelvin–Voigt model, consisting of a spring and a dashpot in parallel; and the Zener model, which combines the Maxwell model with a spring in parallel [4]. The parameters E1 and E2 are the elastic moduli of the parallel and series springs in the Zener model. Integer models use the combination of springs and dashpots to describe the viscoelastic behavior of materials.
When these models are employed to examine the dynamic viscoelastic behavior of materials within the frequency domain, the corresponding constitutive equations are expressed as follows [31]:
 (1)
(1)
 (2)
(2)
 (3)
(3)
where E* = E′ + iE″ is the complex modulus, E′ = Re(E*) is storage modulus, and E″ = Im(E*) is loss modulus. ω = 2πf is angular frequency and f is frequency.
Fractional models are developed by extending integer models with fractional elements to accurately characterize complex viscoelastic behaviors [32]. Figure 5 presents the schematic of the fractional element model and the fractional Zener model obtained by replacing the dashpot with a spring pot in the conventional Zener model [33].
The fractional element model, known as the spring-pot, represents a generalization of both the spring and dashpot. It enables the viscoelastic behavior of materials to be characterized by a single constitutive element. The elastic modulus and viscosity of the spring pot are redefined as Eα and ηα, respectively, to differentiate them from the elastic modulus of the spring and the viscosity of the dashpot. The constitutive equation of the fractional element model in the frequency domain is given by [17]:
 (4)
(4)
where τα = ηα/Eα is relaxation time. The fractional order α (0 < α < 1) governs the transition between purely elastic and purely viscous behaviors. The fractional Zener model is formulated as [33]:
 (5)
(5)
when α = 1, the model turns into the conventional Zener model.
The dependence of the viscoelastic properties on frequency can be characterized by the above constitutive models. The magnitude of the complex modulus is calculated by [33]:
 (6)
(6)
The complex modulus is coupled with the shift factor according to TTSP in the following form [34]:
 (7)
(7)
where  is the modulus at the reference temperature Tr, ωr = αTω is an expanded angular frequency, and αT is the horizontal shift factor at temperature T. The shift factor takes into account the temperature dependence, calculated using the WLF equation [35]:
 (8)
(8)
where C1 and C2 are material parameters.
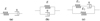 |
Fig. 4 Representation of the integer viscoelastic models: (a) Maxwell model; (b) Kelvin–Voigt model; (c) Zener model. |
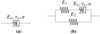 |
Fig. 5 Representation of the fractional models: (a) fractional element model and (b) fractional Zener model. |
2.3 Parameter identification of viscoelastic models based on experimental data
The parameters in the constitutive models should be determined accurately by using the experimental data. The parameter identification procedure can be formulated as a constrained optimization problem, in which the objective is to minimize the error between the model predictions and the experimentally measured DMA data. The problem can be formulated as:
 (9)
(9)
where Θ is the parameter vector, Θmin and Θmax are the parameter boundaries, m is the total number of parameters, S(Θ) is an objective function. The objective function is defined as the sum of the mean square relative errors in storage modulus and loss modulus to ensure that both the energy storage and dissipation are captured. The expression is:
 (10)
(10)
where E′mode and E″mode represent the predicted storage modulus and loss modulus, respectively. E′exp and E″exp are the corresponding experimental data. For the temperature range where the TTSP is applicable, fi represents the reduced frequencies of the master curve. Nf corresponds to the 16 frequency points per isotherm multiplied by the number of temperatures used for the master curve construction. A uniform weighting is assigned to each data point within the objective function. When TTSP is not applicable, fi refers to the original test frequencies (10 to 100 Hz) with Nf. These test frequencies are equidistantly distributed on a logarithmic scale, which ensures a uniform weighting across the entire frequency range.
The objective function balances the impact of the magnitudes of storage modulus and loss modulus by normalization with relative error. The resulting optimization problem is solved by using a nonlinear least-squares algorithm, implemented in MATLAB. The parameters to be identified include E,E1,E2,η,Eα,τα,α. The fractional order α is constrained to the interval (0,1). All other physical parameters are restricted to the positive real domain.
3 Results and discussion
3.1 DMA tests
Figure 6 shows the evolution of complex modulus as a function of strain amplitude of PMMA under different temperatures. The complex modulus remains constant up to a strain amplitude of 0.8% for all the tested temperatures, indicating that PMMA remains in the linear viscoelastic region. At elevated temperatures (130 to 160 °C), the small fluctuations in the complex modulus are observed at low strain amplitudes. This phenomenon arises from the softening of PMMA at high temperatures. At low strain amplitudes, the applied forces are very small. The sensors are not sufficiently sensitive to accurately detect the corresponding forces and displacements. The frequency sweep test was performed under a strain amplitude of 0.5% to avoid inaccurate measurements.
The Cole–Cole plot describes the frequency-dependent dynamic viscoelastic moduli by graphing the loss modulus E″ versus the storage modulus E′ [36], which is used to verify the applicability of TTSP. Figure 7 presents the Cole–Cole plot of the frequency sweep tests. The experimental data do not merge into a single smooth curve at lower temperatures, demonstrating that PMMA exhibits thermorheological complexity due to multiple relaxation processes. This limits the straightforward application of TTSP across entire temperature and frequency ranges [37]. At temperatures above 115 °C, the data points exhibit a relatively smooth and continuous distribution. This phenomenon indicates that the relaxation process of PMMA conforms to a single time scale in this temperature range [38]. TTSP is validated and can be used to construct the master curve. In contrast, the curves between 20 and 110 °C appear irregular and sometimes discontinuous. The relaxation behavior of the material involves multiple time scales. The master curve is not constructed at lower temperatures because the frequency range of 10 to 100 Hz is insufficient to satisfy TTSP. The viscoelastic properties of PMMA below 115 °C should be characterized individually at each temperature. The following sections present a detailed characterization of the DMA results below 115 °C and the master curve at 115 °C. Both the storage and loss moduli are incorporated into the fitting procedure. The results are presented in terms of the complex modulus, which combines both the storage and loss components.
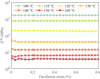 |
Fig. 6 DMA strain sweep test results of PMMA. |
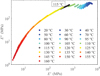 |
Fig. 7 Cole–Cole plot of PMMA obtained from DMA frequency sweep test results. |
3.2 Characterization of DMA results below 115 °C
Figure 8 presents the experimental data for PMMA at 20 °C in logarithmic coordinates and the predictions from the integer and fractional viscoelastic models across the tested frequency range. The complex modulus of PMMA exhibits a linear increase as a function of frequency, adhering to a power-law relationship. The fractional element model (spring-pot: dashed blue line) provides good agreement with the experimental data, while the integer Maxwell model (solid red line) and the Kelvin–Voigt model (dashed red line) fail to capture the experimental response. The comparative analysis illustrates the superiority of the fractional models over the integer models in accurately describing power-law behavior. The fractional element is subsequently employed to characterize the viscoelastic properties within the temperature range of 30 to 110 °C.
Figure 9 presents the fitting results between the experimental data and the fractional element model at different temperatures. Across all temperatures, the complex modulus of PMMA exhibits a power-law increase with frequency to different degrees. A clear decrease in the complex modulus with temperature is observed, reflecting the temperature-dependent softening associated with the transition toward the rubbery regime. The fractional viscoelastic element effectively describes both the frequency and temperature dependencies of PMMA through its fractional parameters, as summarized in Table 2. The fractional order increases with temperature, indicating that the viscoelastic response becomes more sensitive to frequency at higher temperatures. This temperature-dependent trend of the fractional order is consistent with the physical interpretation proposed by Su et al. in [16]. The material gradually transitions from a predominantly elastic glassy state to a more viscoelastic behavior. The high accuracy of the model is demonstrated by the correlation coefficient of approximately 1. The incorporation of fractional derivatives enhances the adaptability of viscoelastic models in characterizing different degrees of power-law behavior.
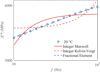 |
Fig. 8 Comparison of experimental data and model predictions at 20°C below 115°C. |
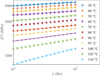 |
Fig. 9 Temperature dependence of the complex modulus fitted by the fractional element model. |
Fractional order α and correlation coefficient (R2) of PMMA at various temperatures.
3.3 Characterization of the master curve at 115 °C
The master curve of PMMA was constructed by TTSP with the reference temperature 115 °C, as shown in Figure 10. The complex modulus decreases with temperature. The master curve at 115 °C is obtained by horizontally shifting the experimental curves of other temperatures based on TTSP. The evolution of the shift factors is accurately described by the temperature-dependent WLF equation, with fitting parameters C1 = 8.1942, C2 = 49.6454. The fitting efficiency is evaluated using the coefficient of determination (R2 = 0.99999) and the standardized root mean square error (standardized RMSE = 0.00100), indicating excellent agreement between the experimental shift factors and the WLF model. The complex modulus exhibits a nonlinear increase from 10 to 103 MPa with frequency. The Maxwell, Kelvin–Voigt, and fractional element models are not suitable for representing the master curve based on their evolution shown in Figure 9. The integer and fractional Zener models are proposed to better characterize the complex viscoelastic behavior.
Figure 11 presents the prediction of the complex modulus of PMMA over a wide frequency range using the integer and fractional Zener models. In Figure 11a, the integer Zener model with different parameter sets is employed to simulate the master curve of the complex modulus. The selection of these parameter sets is based on the intrinsic asymptotic behavior of the integer Zener model. The integer model consists of two springs and one dashpot, corresponding to the parameters E1, E2, and η. E1 and E2 primarily determine two plateaus of the complex modulus at low and high frequencies, while η governs the viscoelastic response in the intermediate frequency range. E1 and E2 are directly identified from the experimental data of PMMA at the lowest and highest frequencies. The parameter η is varied independently over several orders of magnitude to assess the capability of the integer Zener model in describing the frequency-dependent behavior of PMMA. The three parameter sets used are [803 3.8 20], [803 3.8 200], and [803 3.8 2000]. Significant deviations between the experimental data and model predictions suggest that the integer model struggles to accurately capture the viscoelastic behavior of PMMA. The transition frequency is dependent on η, but the slope of the complex modulus in the transition region remains fixed and much steeper than the master curve. The degree of frequency-dependence of complex modulus does not change with model parameters. In contrast, Figure 11b demonstrates that the fractional Zener model provides an excellent fit to the experimental data, with a coefficient of determination of 0.99844 and a mean relative error of 0.0032. The model parameters are as follows: E1 = 850.8106 MPa, E2 = 2.9824 MPa, Eα = 12.5107 MPa, τα = 5.645 s, and α = 0.6519. The frequency-dependent viscoelastic behavior of the fractional model can be adjusted by selecting a fractional order, highlighting the flexibility of fractional models.
The viscoelastic behavior of PMMA at temperatures below 115 °C is accurately characterized using the fractional element model. The viscoelastic behavior of PMMA at temperatures exceeding 115 °C is successfully described using the fractional Zener model integrated with the temperature-dependent WLF equation. The frequency-domain expressions of these fractional models are derived from their time-domain constitutive equations through the Fourier transform. The identified model parameters retain their physical meaning in both time and frequency domains. The corresponding time-domain response (such as creep compliance and relaxation modulus) can be derived via inverse transform. The theoretical equivalence between the time and frequency domains has been well established in literature. Su et al. [39] transformed creep and relaxation data of amorphous polymers from the time domain to obtain the dynamic viscoelastic properties in the frequency domain. The identified fractional model was shown to accurately describe the viscoelastic behavior in both domains. The cross-domain predictive capability of the identified fractional models employed in the present work is validated. The fractional models are capable of predicting the material behavior in the time domain.
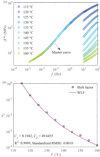 |
Fig. 10 (a) Master curve of complex modulus at reference temperature of 115°C. (b) The shift factors at other temperatures to generate master curve. |
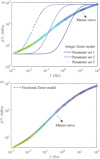 |
Fig. 11 Description of the master curve of PMMA: (a) integer Zener model and (b) fractional Zener model. |
4 Conclusion
The study successfully characterized the linear viscoelastic behavior of PMMA over a wide range of frequencies using a fractional Zener model. The DMA strain amplitude sweep determines a strain amplitude of 0.5% within the linear viscoelastic region at all tested temperatures. The dynamic moduli of PMMA are obtained from the DMA frequency sweep tests across the temperature range of 20 to 160 °C. Below 115 °C, PMMA does not conform to the TTSP because of the discontinuity in the Cole–Cole plot. The fractional element model shows excellent ability in describing the frequency- and temperature-dependent power-law behavior of PMMA compared to the integer Kelvin–Voigt and Maxwell models. At temperatures equal to or exceeding 115 °C, the TTSP can be effectively employed to analyze the material, as demonstrated by the Cole–Cole plot. A master curve across a wider frequency range is constructed using shift factors at a reference temperature of 115 °C. The master curve is accurately described by the fractional Zener model. The fractional order of the fractional model allows for a more flexible transformation of the frequency dependence of viscoelastic materials than the conventional integer Zener model. The temperature dependence of PMMA from 115 to 160 °C could be described by the WLF equation. This temperature dependence can be integrated with a viscoelastic model to describe both the frequency- and temperature-dependent viscoelastic behavior. Time-domain mechanical tests (such as creep and stress relaxation experiments) are planned to further experimentally validate the cross-domain consistency and the long-term predictive capability of the identified fractional models.
Acknowledgments
The authors are grateful for the financial support of the China Scholarship Council (CSC) via the National Construction High-level University Postgraduate Program.
Funding
This work was supported by the China Scholarship Council under grant number 202208130030.
Conflicts of interest
The authors declare that they have no known competing financial interests or personal relationships that could have appeared to influence the work reported in this paper.
Data availability statement
This article has no associated data generated and/or analyzed.
Author contribution statement
Rongqi Dang prepared the original manuscript and performed the analysis. Gang Cheng, Michel Gratton, and Roger Serra reviewed the manuscript and provided constructive comments on its structure and content. All authors approved the final manuscript.
References
- B. Zheng, S. Zhang, G. Shu, Z. Sun, Y. Wang, J. Xie, Experimental investigation and modeling of the mechanical properties of construction PMMA at different temperature, Structures 57, 105091 (2023) [Google Scholar]
- H. Koruk, S. Rajagopal, A comprehensive review on the viscoelastic parameters used for engineering materials, including soft materials, and the relationships between different damping parameters, Sensors 24, 6137 (2024) [Google Scholar]
- L. Li, Y. Zhang, L. Sun, H. Hu, Effects of strain rate and temperature on the mechanical behavior of polymethyl methacrylate (pmma), Polymer Bull. 80, 8685–8702 (2023) [Google Scholar]
- R. Dang, Y. Chen, Fractional modelling and numerical simulations of variable-section viscoelastic arches, Appl. Math. Comput. 409, 126376 (2021) [Google Scholar]
- C. Han, Y. Chen, G. Cheng, R. Serra, L. Wang, J. Feng, Numerical analysis of axially non-linear viscoelastic string with the variable fractional order model by using Bernstein polynomials algorithm, Int. J. Comput. Math. 99, 537–552 (2022) [Google Scholar]
- R. Dang, Y. Cui, J. Qu, A. Yang, Y. Chen, Variable fractional modeling and vibration analysis of variable-thickness viscoelastic circular plate, App. Math. Model. 110, 767–778 (2022) [Google Scholar]
- L. Sun, Y. Chen, R. Dang, G. Cheng, J. Xie, Shifted Legendre polynomials algorithm used for the numerical analysis of viscoelastic plate with a fractional order model, Math. Comput. Simul. 193, 190–203 (2022) [Google Scholar]
- C.A. Mahieux, K.L. Reifsnider, Property modeling across transition temperatures in polymers: a robust stiffness-temperature model, Polymer 42, 3281–3291 (2001) [Google Scholar]
- J. Richeton, G. Schlatter, K. Vecchio, Y. Rémond, S. Ahzi, A unified model for stiffness modulus of amorphous polymers across transition temperatures and strain rates, Polymer 46, 8194–8201 (2005) [Google Scholar]
- R. M. Boumbimba, S. Ahzi, N. Bahlouli, D. Ruch, J. Gracio, Dynamic mechanical properties of PMMA/organoclay nanocomposite: experiments and modeling, J. Eng. Mater. Technol. 133, 030908 (2011) [Google Scholar]
- V. Annarasa, A.A. Popov, D.S. De Focatiis, A phenomenological constitutive model for the viscoelastic deformation of elastomers, Mech. Time-Depend. Mater. 24, 463–479 (2020) [Google Scholar]
- M. Shitikova, A. Krusser, Models of viscoelastic materials: a review on historical development and formulation, in: Theoretica l Analyses, Computations, and Experiments of Multiscale Materials: A Tribute to Francesco dell’Isola, pp. 285–326, 2022. https://doi.org/10.1007/978-3-031-04548-6_14. [Google Scholar]
- Z. Shu, R. You, Y. Zhou, Viscoelastic materials for structural dampers: a review, Constr. Build. Mater. 342, 127955 (2022) [Google Scholar]
- L. Zhang, X. Wei, Y. Zhang, The creep model based on nonlinear newton body under different temperature conditions, Sci. Rep. 13, 4822 (2023) [Google Scholar]
- R. Esmaeeli, S. Farhad, Parameters estimation of generalizedMaxwell model for SBR and carbon-filled SBR using a direct high-frequency DMA measurement system, Mech. Mater. 146, 103369 (2020) [Google Scholar]
- X. Su, W. Xu, W. Chen, H. Yang, Fractional creep and relaxation models of viscoelastic materials via a non-newtonian time-varying viscosity: physical interpretation, Mech. Mater. 140, 103222 (2020) [Google Scholar]
- S. Cai, Y. Chen, Q. Liu, Development and validation of fractional constitutive models for viscoelastic-plastic creep in time-dependent materials: Rapid experimental data fitting, Appl. Math. Model. 132, 645–678 (2024) [Google Scholar]
- L. Sun, C. Gang, B. Thierry, Numerical modeling and experimental investigations of creep behaviour of polycarbonate, Materials Research Proceedings, 54. https://doi.org/10.21741/9781644903599-201 [Google Scholar]
- A. Hernández-Jiménez, J. Hernández-Santiago, A. Macias-García, J. Sánchez-González, Property modelling relaxation modulus in PMMA and PTFE fitting by fractional Maxwell model, Polym. Test. 21, 325–331 (2002) [Google Scholar]
- K. Ikeda, K. Kuga, M. Fujikawa, Thermal–viscoelastic analysis of polymethyl methacrylate using a fractional differential viscoelastic model, Modern Phys. Lett. B 38, 2330004 (2024) [Google Scholar]
- O. Atmani, F. Abbès, Y. Li, S. Batkam, B. Abbès, Experimental investigation and constitutive modelling of the deformation behaviour of high impact polystyrene for plug-assisted thermoforming, Mechanics Industry 21, 607 (2020) [Google Scholar]
- S. Zafar, A. Verma, Mathematical modeling of creep and creep-recovery behavior of polymer matrix composites, in: Dynamic Mechanical and Creep-Recovery Behavior of Polymer-Based Composites, Elsevier, 2024, pp. 253–269. https://doi.org/10.1016/B978-0-443-19009-4.00015-1 [Google Scholar]
- S. Sheng, M. Wu, W. Lv, Dynamic viscoelastic behavior of maize kernel: Application of frequency–temperature superposition, Foods 13, 976 (2024) [Google Scholar]
- S. Mazurchevici, A. Marguta, D. Nedelcu, Characteristics of biodegradable polymers when subjected to ceramic coatings, Mechanics Industry 25, 30 (2024) [Google Scholar]
- D. Ionita, M. Cristea, C. Gaina, Prediction of polyurethane behaviour via time-temperature superposition: Meanings and limitations, Polym. Test. 83, 106340 (2020) [Google Scholar]
- H. Li, R. Xiao, Glass transition behavior of wet polymers, Materials 14, 730 (2021) [Google Scholar]
- Z.M. Pawlak, A. Denisiewicz, Identification of the fractional Zener model parameters for a viscoelastic material over a wide range of frequencies and temperatures, Materials 14, 7024 (2021) [Google Scholar]
- ASTM D5024-15: Standard test method for plastics: Dynamic mechanical properties: In compression, ASTM International (2023). https://doi.org/10.1520/D5024-15 [Google Scholar]
- A. Kaboorani, P. Blanchet, Determining the linear viscoelastic region of sugar maple wood by dynamic mechanical analysis, BioResources 9, 4392–4409 (2019) [Google Scholar]
- R. Gedney, An introduction to viscoelasticity dynamic mechanical analysis, Qual. Mag. (2019). https://doi.org/10.1016/j.polymertesting.2024.108402 [Google Scholar]
- A. Bonfanti, J.L. Kaplan, G. Charras, A. Kabla, Fractional viscoelastic models for power-law materials, Soft Matter 16, 6002–6020 (2020) [Google Scholar]
- M. Hafez, F. Alshowaikh, B.W.N. Voon, S. Alkhazaleh, H. Al-Faiz, Review on recent advances in fractional differentiation and its applications, Prog. Fract. Differ. Appl. 11, 245–261 (2025) [Google Scholar]
- Q. Zhang, X. Gu, Q. Dong, J. Liang, Modified fractional-zener model—numerical application in modeling the behavior of asphalt mixtures, Constr. Build. Mater. 388, 131690 (2023) [Google Scholar]
- J. Adams, C. Merrett, Comparing different data processing methods for determining a Prony series from dynamic mechanical analyzer frequency data, Polym. Eng. Sci. 63, 1459–1470 (2023) [Google Scholar]
- T. Kopač, Mathematical model for characterization of temperature-responsive polymers: a study on the rheological behavior of gelatin and poly (N-isopropylacrylamide), Polym. Test. 133, 108402 (2024) [Google Scholar]
- X. Liu, D. Zhu, J. Lin, Y. Zhang, Temperature and frequency dependence of the dynamic viscoelastic properties of silicone rubber, Polymers 15, 3005 (2023) [Google Scholar]
- N. Hernandez-Fernandez, A. Ossa-Lopez, Validation of partial time-temperature superposition principle in thermorheologically complex asphalts, Constr. Build. Mater. 276, 122224 (2021) [Google Scholar]
- L. Kehrer, J. Keursten, V. Hirschberg, T. Böhlke, Dynamic mechanical analysis of PA 6 under hydrothermal influences and viscoelastic material modeling, J. Thermoplast. Compos. Mater. 36, 4630–4664 (2023) [Google Scholar]
- X. Su, D. Yao, W. Xu, Processing of viscoelastic data via a generalized fractional model, Int. J. Eng. Sci. 161, 103465 (2021) [Google Scholar]
Cite this article as: R. Dang, G. Cheng, M. Gratton, R. Serra, Fractional model for the characterization of the linear viscoelastic behavior of thermoplastic polymer, Mechanics & Industry 27, 25 (2026), https://doi.org/10.1051/meca/2026016
All Tables
Fractional order α and correlation coefficient (R2) of PMMA at various temperatures.
All Figures
|
Fig. 1 Schematic of viscoelastic constitutive elements. |
| In the text | |
|
Fig. 2 Configurations of PMMA specimen. |
| In the text | |
|
Fig. 3 ElectroForce 3200 Series III test instruments. |
| In the text | |
|
Fig. 4 Representation of the integer viscoelastic models: (a) Maxwell model; (b) Kelvin–Voigt model; (c) Zener model. |
| In the text | |
|
Fig. 5 Representation of the fractional models: (a) fractional element model and (b) fractional Zener model. |
| In the text | |
|
Fig. 6 DMA strain sweep test results of PMMA. |
| In the text | |
|
Fig. 7 Cole–Cole plot of PMMA obtained from DMA frequency sweep test results. |
| In the text | |
|
Fig. 8 Comparison of experimental data and model predictions at 20°C below 115°C. |
| In the text | |
|
Fig. 9 Temperature dependence of the complex modulus fitted by the fractional element model. |
| In the text | |
|
Fig. 10 (a) Master curve of complex modulus at reference temperature of 115°C. (b) The shift factors at other temperatures to generate master curve. |
| In the text | |
|
Fig. 11 Description of the master curve of PMMA: (a) integer Zener model and (b) fractional Zener model. |
| In the text | |
Current usage metrics show cumulative count of Article Views (full-text article views including HTML views, PDF and ePub downloads, according to the available data) and Abstracts Views on Vision4Press platform.
Data correspond to usage on the plateform after 2015. The current usage metrics is available 48-96 hours after online publication and is updated daily on week days.
Initial download of the metrics may take a while.