


Fig. 20
Download original image
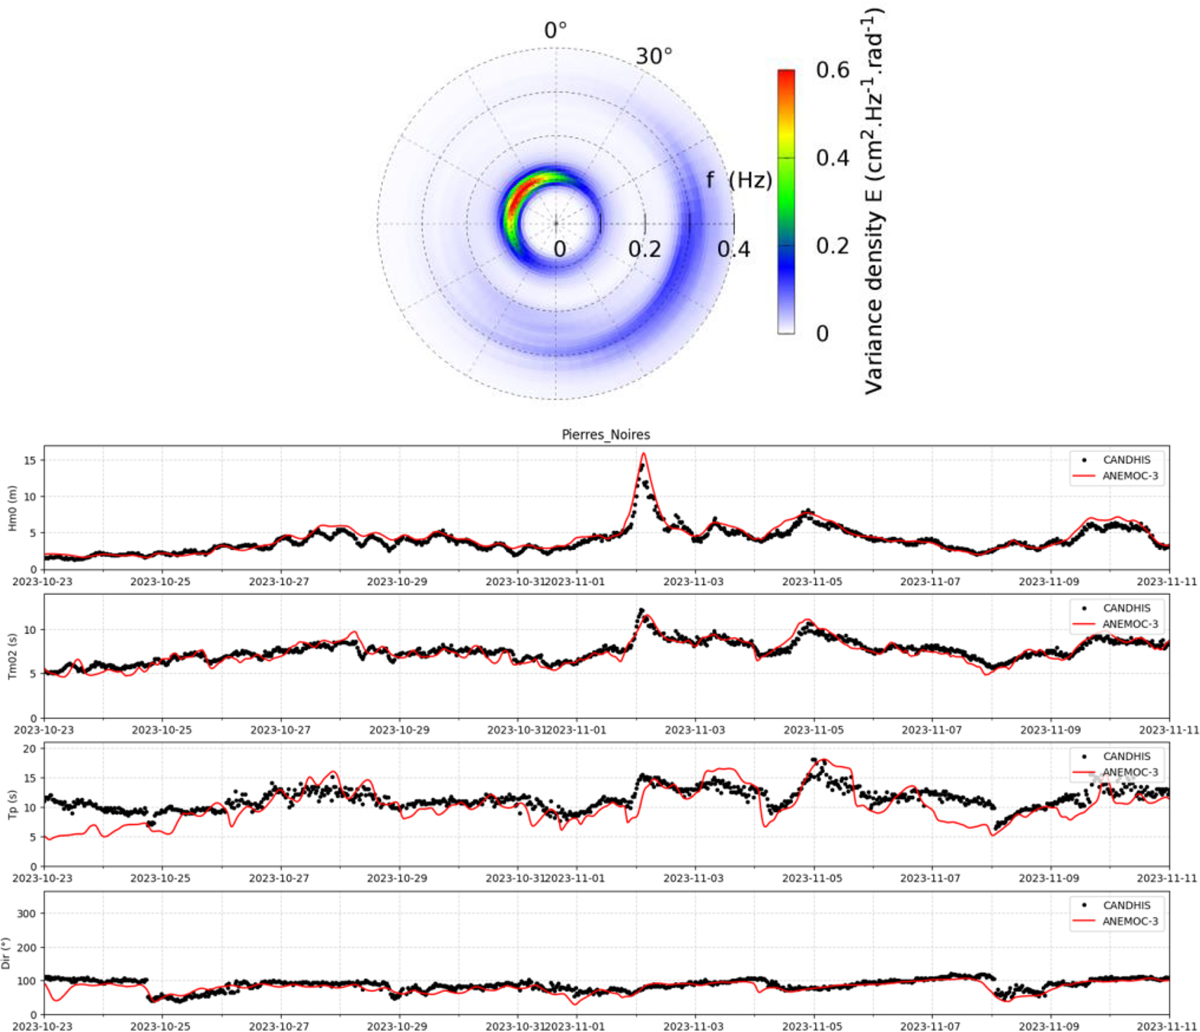
Top: simulation example of the angle-frequency spectrum of wave action at a point in a coastal area, extracted from a two-dimensional geographic model [9]. Such predictions allow calculating the wave statistics for engineering purposes like the design of coastal defense waterworks, e.g. the significant wave height Hm0, the Tm02, the peak period Tp and the mean direction of propagation. Anexample of timeseries of these quantities is displayed on the bottom, for a point located near Brest where buoy data are available for comparison during October 2023; the main peak of Hm0 is the Ciaran storm.
Current usage metrics show cumulative count of Article Views (full-text article views including HTML views, PDF and ePub downloads, according to the available data) and Abstracts Views on Vision4Press platform.
Data correspond to usage on the plateform after 2015. The current usage metrics is available 48-96 hours after online publication and is updated daily on week days.
Initial download of the metrics may take a while.