| Issue |
Mechanics & Industry
Volume 25, 2024
|
|
|---|---|---|
| Article Number | 1 | |
| Number of page(s) | 9 | |
| DOI | https://doi.org/10.1051/meca/2023042 | |
| Published online | 22 January 2024 | |
Regular Article
Optimization of energy efficiency and NVH behaviour of a helical gear unit
1
Univ Lyon, Ecole Centrale de Lyon, CNRS, LTDS, UMR5513, 69134 Ecully, France
2
Univ Lyon, INSA Lyon, CNRS, LaMCoS, UMR5259, 69621 Villeurbanne, France
3
Univ Lyon, ECAM LaSalle, LabECAM, 69321 Lyon, France
* e-mail: This email address is being protected from spambots. You need JavaScript enabled to view it.
Received:
1
February
2023
Accepted:
22
November
2023
Abstract
The goal of this study is to perform a multi-objective optimization of a gear unit in order to improve its performance in terms of mechanical power losses, gear dynamics and equivalent sound power radiated by the housing. All these key performance indicators are closely related to the gear macro- and micro-geometry parameters. Decision variables chosen are the helix and pressure angles as macro-geometry parameters, and the amount and dimensionless roll length of tip relief as micro-geometry parameters corresponding to gear profile modifications. The multi-objective optimization is carried out under geometric and load capacity constraints using the evolutionary NSGA-II algorithm. Various results, observed in the form of 3D Pareto front confirm that improvements in energy efficiency and vibroacoustic performance are antagonistic. Nevertheless, a significant decrease of mechanical power losses is possible without degrading the vibroacoustic performance much. Otherwise, the correlation between the gear dynamic response and the equivalent radiated sound power (ERP) is partial. The minimization of the equivalent sound power radiated by the housing is not equivalent to the minimization of the gear transmission error fluctuation. These results underline the interest of modelling the whole gear unit to optimize its efficiency and NVH behaviour.
Key words: Multi-objective optimization / NSGA2 heuristic / helical gear macro-geometry and micro-geometry / mechanical power losses / transmission error fluctuation / equivalent radiated sound power (ERP)
© E.B. Younes et al., Published by EDP Sciences 2024
 This is an Open Access article distributed under the terms of the Creative Commons Attribution License (https://creativecommons.org/licenses/by/4.0), which permits unrestricted use, distribution, and reproduction in any medium, provided the original work is properly cited.
1 Introduction
Mechanical engineering applications widely use gear devices to transmit a force and a rotational motion, because they respond to power requirements and precision imposed to modern architectures of kinematic chains [1]. Numerous items should be considered at design stage such as energy consumption, pollution or NVH performance and engineers have to combine sometimes antagonistic constraints, such as minimize on-board mass, power losses, dynamic mesh loads, pressures and stresses, excitation sources, vibroacoustic behaviour, etc. In order to do that, designers increasingly resort to optimization methods [2]. For example, some mono-objective optimizations have been performed in order to minimize the helical gear unit mass [3] or the multi-stage gear driveline volume [4]. Multi-objective optimizations (MOO) of cylindrical gears have also been performed, sometimes associated with contradictory requirements. As an example, the following studies can be emphasised: (i) Sanghvi et al. optimized the load carrying capacity and volume [5]; (ii) Yao optimized the bearing capacity coefficient, spur gear efficiency and centre distance [6]; (iii) Padmanabhan et al. minimized the centre distance and overall mass, while improving performance in terms of transmitted power and gear efficiency [7]; (iv) Li et al. minimized, the transmission error, contact stress and gearbox volume [8]; (v) Patil et al. minimized the power losses and gearbox volume [9]. In these works, the gear design macro-geometry parameters were chosen as decision variables.
Some other studies have considered the gear micro-geometry parameters. In fact, gear tooth profile deviation is often adopted to avoid premature contact between gear teeth and optimize contact conditions. In these works, the amount and dimensionless roll length of tip relief modification were chosen as decision variables in order to optimize the gear transmission error fluctuation [10–13] mechanical power losses and efficiency, or noise and durability [14–16]. Most studies in the literature resort to optimizing only gear pair and shafts, rather than the whole power transmission. Regarding NVH performance, the objective function retained is often the minimization of the gear transmission error fluctuation rather than the whining noise radiated by the gearbox. Regarding efficiency, the power losses considered are often limited to tooth friction losses and the interaction between power losses and temperatures is to the best of our knowledge not considered.
In a companion paper [17], a single-stage helical gear unit efficiency was evaluated using the thermal network method in order to evaluate the bulk temperature of each gear unit component and take account of the interconnection between the numerous heat sources, i.e. the tooth friction losses, rolling element bearing losses, shaft seal losses and churning losses. MOO is carried out using the evolutionary NSGA-II algorithm, in order to minimize power losses and transmission error fluctuation. The set of decision variables corresponded to macro- and/or micro-geometry parameters. The results were in the form of a Pareto front. They showed that the values of decision variables associated with optimal solutions when considering the total power losses differ from those obtained when considering only the tooth friction losses. In addition, they showed the interest of optimizing both the macro- and micro-geometry parameters to optimize performance in terms of efficiency and transmission error. Therefore, MOO performed with macro- and micro-geometry parameters considered simultaneously leads to a wider Pareto front than successive MOO performed firstly with macro-geometry parameters and secondly with micro-geometry parameters.
Based on these conclusions, the goal of this work is to extend the previous study which integrates a global vision of power losses to a global vision of NVH behaviour, via the analysis of the vibroacoustic response of the housing of the studied gear unit. Thus, MOO of the gear unit is carried out under constraints. Both gear design macro- (helix and pressure angles) and micro-geometry parameters (amount and dimensionless roll length of tip relief) are chosen as decision variables. The objective functions are not only the mechanical power losses of the gear unit and transmission error fluctuation (associated with the gear pair behaviour), but also the equivalent radiated sound power (ERP) associated with the vibroacoustic response of the housing.
The first part of the document presents the system under study, as well as the thermal network and the different mechanical power losses considered (tooth friction losses, bearing losses, shaft seal losses and churning losses). Then, the dynamic models of the driveline and the housing are described, allowing estimation of the transmission error fluctuation, the dynamic mesh force and the equivalent sound power radiated by the housing. The objective functions, constraints and decision variables are presented, as well as NSGA-II algorithm parameters. Finally, MOO results are presented and discussed.
2 Modelling of the gear unit
2.1 Description of the gear unit
Figure 1 displays the gear unit under study. The main characteristics of the helical gear pair (Z1:Z2 = 29:80) have been described in detail in the companion paper [17]. Stationary operating conditions are assumed: nominal input torque is 500 N and nominal input rotational speed is 3000 rpm, corresponding to an input power equal to 25 kW. The mesh frequency is equal to fm = 1450 Hz. Gears are splash lubricated by oil. Shafts are supported by ball bearings and enclosed in a (380 × 280 × 150 mm3) rectangular parallelepiped housing. The thickness of the steel walls is 10 mm.
The gear design macro-geometry parameters chosen as decision variables for the optimization are the helix angle β (β ∈ [0°–30°]) and the normal pressure angle α0 (α0 ∈ [15°–25°]. The centre distance is imposed (aw = 174 mm). Consequently, the normal module mn depending from the helix angle β is evaluated as follows:
 (1)
(1)
Two micro-geometry parameters are chosen for each gear wheel as decision variables [18]. Ei is the amount of linear tip relief. Γi is the dimensionless tip relief roll length (related to the path of contact length). The ranges of variation of micro-geometry parameters are presented in Table 1.
 |
Fig. 1 Single stage gear unit. |
Gear micro-geometry characteristics.
2.2 Thermal network and calculation of power losses
The total mechanical power losses (Qtotal) in the gear unit are evaluated using the thermal network method described in detail in the companion paper [17]. To this end, the gear unit is discretised into 14 isothermal elements (see Fig. 2). The first one is associated with surrounding ambient air. The housing is decomposed into 3 parts, i.e. an upper part, a lateral part supporting bearings and a lower part containing the oil sump (modelled by a sole isothermal element). Other isothermal elements are introduced to model each of the 4 bearings, 2 shafts and 2 gear wheels, as well as the meshing zone where friction between gear teeth occurs. Elements are connected by thermal resistances depending on the type of heat transfer. Heat exchange between the housing and surrounding ambient air are modelled by convection and radiation resistances. Heat exchange between housing internal walls, gear wheels and bearings on the one hand and oil in the other hand are modelled by convection resistances. Heat exchange between gear wheels, bearings and shafts are modelled by conduction thermal resistances. Analytical models used to quantify resistances are presented in detail in [19,20].
The different mechanical power losses considered (tooth friction losses, bearing losses, shaft seal losses and churning losses) are evaluated by taking account of node temperatures to insure the thermo-mechanical coupling through oil properties variation (see Tab. 2). The steady-state temperature distribution in the gear unit is simulated from an iterative procedure. As a result, total mechanical power losses are calculated from the sum of the above-mentioned contributions.
 |
Fig. 2 Thermal network for the studied single stage gear unit [17]. Numbering of isothermal elements: (1) = ambient air; (2) = upper part of the casing; (3) = lateral part of the casing; (4) = lower part of the casing;(5) = oil sump; (6) and (7) = bearings on pinion's shaft; (8) and (9) = bearings on wheel's shaft; (10) = pinion's shaft; (11) = wheel's shaft; (12) = pinion; (13) = wheel; (14) = meshing zone of gear teeth. |
Lubricant properties.
2.3 Model of the drive line and calculation of dynamic mesh force and transmission error fluctuation
The drive line of the gear unit is modelled using the finite element method. Each gear wheel is model by a rigid cylinder with 6 degrees of freedom (dof). The shafts are modelled by Timoshenko's beam elements with two nodes and six dof per node. Each bearing is modelled by 1 axial stiffness's element and 2 radial and stiffness's elements. Each mechanical coupling is modelled by a torsional stiffness and connected to an inertial element modelling the motor or the receiver inertia. The corresponding model of the drive line includes 36 degrees of freedom. The contact lines between the pinion and the driven wheel are discretized into several elements associated with elementary stiffness elements taking account of gear tooth elasticity and with initial gap vectors taking account of the micro-geometry tooth profile deviations.
The equation of motion of the drive line is [21]:
 (2)
(2)
[M] and [Cv] are the mass and damping matrices. [K(t,x)] is the non-linear time-varying stiffness matrix. F0 is the external load vector. F1 (t, x, δe (M)) is the time-varying force vector including the contribution of tooth profiles deviations. δe(M) is the relative deviation and  takes account of inertial effects due to unsteady rotational speed. The total dynamic mesh force and the root mean square value of the transmission error fluctuation (TERMS) are evaluated from equation (2) and from the unloaded static transmission error (corresponding to very low applied torque and input rotational speed). Equation (2) is solved using a Newmark's implicit scheme coupled to a normal contact algorithm. The procedure is described in detail in [21] and in the companion paper [17].
2.4 Model of the housing and calculation of the equivalent radiated power (ERP)
The vibroacoustic response of the gear unit excited by the dynamic mesh force is computed assuming that the 10 mm thick- steel housing is elastic and fitted on its base. It is discretized by 500 3-D structural solid elements with 8 nodes and 3 dof per node and by 6000 structural shell elements with 4 nodes and 6 dof per node (see Fig. 3).
The model of the whole gear unit, including the drive line, encompasses 7400 nodes and around 40000 degrees of freedom. From numerical modal analysis, the whole gear unit shows 280 modes between 0 and 20 kHz. An equivalent viscous damping equal to 5% is introduced for each mode.
The sound power radiated by the gear unit is estimated from the mean square vibration velocity averaged over the outer surface [22]. It is defined as follows:
 (3)
(3)
ρ0 and c0 are respectively the air density (1.2 kg m−3) and the sound velocity in air (340 ms−1) at ambient temperature, S is the radiating surface area of the gear unit housing, v (M,t) is the normal velocity at a point M of the housing surface and  is the time (upper bar −) and space averaged (brackets <>s) mean square vibrational velocity. The evaluation of sound power from the housing surface vibration is an approximate method because the radiation efficiency σrad is difficult to assess. As a first assumption, the acoustic couplings between the different faces of the parallelepiped housing are assumed to be negligible. Consequently, the acoustic power is evaluated as the sum of the acoustic powers radiated by each radiating face assumed to be baffled. As a second assumption, the critical frequency fc is introduced, which for uniform infinite flat plates is [23,24]:
 (4)
(4)
ρ is the material density, E and v its Young's modulus and Poisson's ratio and h its thickness. The radiation efficiency σrad is usually greater than 1 at frequencies around fc, close to 1 at frequencies above fc and lower than 1 at frequencies below fc. Likewise, for a baffled finite plate, it is usual to assume that σrad tends towards 1 beyond fc. The critical frequency calculated for the studied steel housing is fc = 1175 Hz and is lower than all exciting frequencies, corresponding to harmonics of mesh frequency (fm = 1450 Hz). Therefore, a value σrad ≈ 1 is assumed. The radiated sound power corresponds to the Equivalent Radiated Power [25], noted ERP, which is retained as the vibroacoustic indicator of the whole gear unit.
 (5)
(5)
For a harmonic excitation at frequency ω, the mobility which relates the output velocity V(ω) at point M to the dynamic mesh force F(ω) is described by the complex frequency response function HV,F (M,ω). The time and space averaged mean square vibrational velocity is:
 (6)
(6)
 (7)
(7)
For each harmonic, the surface integral  is the transfer function between the quadratic value of the dynamic mesh force and the mean square vibration velocity averaged over the housing surface. It is estimated beforehand via the finite element analysis. For this, a unit dynamic mesh force F(ω) is applied on the gear unit finite element model without elastic coupling between gear wheels, and normal velocities are computed on each element of the housing affected by its elementary external area (collocation technique). The estimated integral is then given by:
 (8)
(8)
where N is the total number of elementary surfaces of area sj located at each point Mj.
 (9)
(9)
The first five harmonics of the periodic dynamic mesh force at frequency ωm are retained, so that:
 (10)
(10)
and finally:
 (11)
(11)
The ERP level in decibels is:
 (12)
(12)
with reference acoustic power IIref = 10-12 W.
The respective weight of axial and radial components associated with the dynamic mesh force transmitted to the housing is affected by a change in gear design macro-geometry parameters α0 and β. In practice, the surface integral J(w,α0, β) is evaluated for a discrete number of normal pressure angle and helix angle values which extend over the entire range of variation of these decision variables. For each individual of the multi-objective optimization algorithm with design parameters (α0, β), a bilinear interpolation of the surface integral J(w,α0, β) is performed from these discrete values, for each of the first five harmonics of the periodic dynamic mesh force. Then, the ERP level in decibels is estimated from equations (11) and (12).
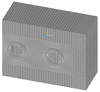 |
Fig. 3 Housing meshing. |
3 Functions, decision variables and constraints of the MOO algorithm
The goal of this work is to perform a MOO of the gear unit under constraints. The 3 objective functions to minimize are:
The mechanical power losses (Qtotal) of the gear unit evaluated from interaction between temperature and the different power losses considered (tooth friction losses, bearing losses, shaft seal losses and churning losses),
The transmission error fluctuation (root mean square value TERMS associated with the gear pair behaviour),
The ERP level in decibels (Lw) associated with the vibroacoustic response of the housing.
The decision variables are:
2 design macro-geometry parameters corresponding to the helix angle β and normal pressure angle α0,
4 micro-geometry parameters corresponding to the amounts of tip relief for pinion and driven wheel teeth (E1,E2) and the dimensionless tip relief roll lengths (Γ1,Γ2).
Therefore, the decision variables vector is:
 (13)
(13)
The boundaries of the decision variables have been presented in § 2.1.
The design space must be constrained in order to ensure that the solutions are feasible. First, geometric constraints are introduced in order to ensure that the gear is functional [26]. Operating centre distance and gear design macro-geometry parameters have been chosen in order to avoid interference and too thin thicknesses at the tooth tip. The total contact ratio h1(X) must also ensure a continuous motion transmission (h1(X) ≥ 1.2). Then, constraints associated with load capacity are introduced in order to ensure that the gear can withstand operational conditions. The tooth root bending stress h2(X) is evaluated for pinion and driven wheel, from standard formula ISO-6336 (method B) [27] (h2(X) ≤ 500 MPa). For each angular position, the maximum contact pressure h3(X) is also checked (h3(X) ≤ 1.2 GPa). Finally, the MOO problem is written as follows:
 (14)
(14)
The problem is solved using the NSGA-II algorithm. In fact, this one is usually adopted for solving MOO problems due to its fast convergence, efficiency and ability to test and preserve diversity (i.e. a distribution of solutions from the Pareto front) [28,29]. Suitable values for parameters of the NSGA-II algorithm (selection strategy, mutation type and rate, crossover type, population size, maximum number of generations) correspond to those presented in detail in the companion paper [17].
4 Results and discussion
Before the MOO is performed, objective functions have been evaluated for a reference point (α0 = 20° and β = 20°) without micro-geometry tooth profile modifications and which respects geometric and load capacity constraints. The corresponding decision variables and objective functions values are listed in Table 3. The mechanical power losses (Qtotal = 1900 W) are equal to 7.5% of the input power. They are generated in order of importance by tooth friction losses (60%), churning losses (22%), bearing losses (15%) and seal losses (3%). The oil sump temperature for the reference point stays below 100 °C (in this case 96.3 °C). In contrast, the pinion bulk reaches 110 °C. The transmission error fluctuation is TERMS = 0.35 μm and the ERP level is Lw = 92 dB.
Figure 4d displays the 3D Pareto front resulting from MOO, that is to say the set of non-dominated solutions corresponding to the best compromises between objectives. Figures 4a, 4b and 4c display the projections of the Pareto front on respectively TERMS–Qtotal plane, Lw–Qtotal plane and TERMS–Lw plane. Four specific points are introduced:
P1 corresponds to the minimum mechanical power losses (Qtotal = 1240 W). Among all points of the Pareto front, it is also associated with both the maximum of transmission error fluctuation (TERMS =1.80 μm) and ERP level (Lw = 101.3 dB).
P2 is the selected optimal solution among all points of the Pareto front.
P3 corresponds to the minimum transmission error fluctuation (TERMS = 0.23 μm).
P4 corresponds to the minimum ERP level (Lw = 82.1 dB).
For clarity, the Pareto front is broken down into 2 sets. The first side of the Pareto front starts from P1 and ends at P2. It corresponds to the line displayed using red empty circles. The second side starts from P2 and ends at P3 and P4. It corresponds to the surface displayed using blue solid circles. Figure 5 displays the evolution of decision variables associated to the Pareto front and Table 3 lists the objective functions values and decision variables for specific points P1 to P4.
The Pareto front clearly shows that the improvement of one performance leads to the degradation of another and objectively highlights the antagonism between the objectives related to the improvement of energy efficiency on the one hand and dynamic and vibroacoustic performances on the other hand.
On one side of the Pareto front, the 2 points P3 (minimum transmission error fluctuation) and P4 (minimum ERP level) correspond to similar small removals of material from the gear tooth flanks. Normal pressure angles are similar (α0≈18°) but the helix angle values differ (β = 16.5° at P3 and β = 13.8° at P4). As expected, minimum transmission error fluctuation is obtained for an overlap ratio εβ ≈ 1 which minimizes the fluctuation of gear contact length. But the mechanical power losses still reach 7% of the input power which is barely better than the reference point.
On the other side of the Pareto front, point P1 corresponds to power losses equal to 4% of the input power. This minimum value is associated with a high-pressure angle (α0 = 23°) as predicted by mono-objective optimizations. For example, Höhn et al. [30,31] showed that tooth friction power losses decrease with high pressure angle. They also generally increase with helix angle because the tooth wetted surface involved in churning power losses increases, as well as the axial forces transmitted to the housing involved in bearing losses. Point P1 also corresponds to large removal of material from the gear tooth flanks. This significant profile modification is required in order to reduce contact forces in the area of high sliding velocities but it leads also to a decrease of the effective contact length, which affects the transmission error fluctuation [32].
So, the Pareto front allows us to conclude on the strength of the relationship between power losses and NVH behavior: A gain of 25% on power losses leads to a too large deterioration of radiated noise (+20 dB). The vibroacoustic response amplitude becomes unreasonable with regard to the size of the transmission and the power transmitted.
The point P2 results from the implementation of a decision maker in order to select the optimal solution among all points of the Pareto front (see [6]). Compared to the reference point, the specific point P2 shows a large decrease of power losses (from 1900 to 1400 W) without degradation of the vibroacoustic performance (Lw = 91.3 dB instead of 92 dB for the reference point). Compared to the point P1 the normal pressure and helix angles are almost constant. The significant decrease of both TERMS (from 1.80 to 0.63 μm) and Lw (from 101.3 to 91.3 dB) can be explained by reduction by more than half of removed material: a large decrease of the amount of tip relief E and a small decrease of the dimensionless tip relief roll length Γ lead to variations of products (E1Γ1; E2 Γ2) from (35.4 μm; 26.3 μm) at P1 to (16.6 μm; 9.3 μm) at P2. At the same time, a reasonable and slight increase of Qtotal is observed (from 1240 W at P1 to 1400 W at P2). When the Pareto front is browsed from P3 and P4 towards P2, a steep slope of the Pareto front is observed. The significant decrease of power losses can be explained by the large increase of the normal pressure angle.
Otherwise, the first side of the Pareto front (from P1 to P2) shows a strong correlation between the transmission error fluctuation TERMS and the ERP level Lw while they become independent on the second side (from P2 to P3 and P4). Thus, P3 corresponding to the minimum transmission error fluctuation shows a much higher ERP level than P4 corresponding to the minimum ERP level (Lw = 85.3 dB instead of 82.1 dB). Furthermore, a difference of up to +6 dB can be observed between 2 points of the Pareto front showing a similar transmission error fluctuation. This can be explained by the slight decrease of helix angle β which leads to a decrease of the surface integral function J(w, α0, β) corresponding to a different balance between the axial and the radial forces transmitted to the bearings and the housing. So, the minimization of the ERP level Lw, associated with the vibroacoustic response of the housing is not equivalent to the minimization of the transmission error fluctuation TERMS, associated with the gear pair behaviour.
Features of reference point and specific points of the Pareto front.
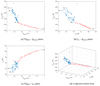 |
Fig. 4 Pareto front of the multi-objective optimization. (*) Reference point. P1, P2, P3, P4: specific points. |
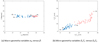 |
Fig. 5 Decision variables associated to the Pareto front. P1, P2, P3, P4: specific points. |
5 Conclusion
A multi-objective optimization based on NSGA-II algorithm has been performed in order to improve performances of a single-stage helical gear unit, under geometric and load capacity constraints. Its efficiency is improved via minimization of mechanical power losses (taking account of tooth friction losses, bearing losses, shaft seal losses and churning losses), and its dynamic and vibroacoustic behaviour is improved via minimization of the transmission error fluctuation (associated with the gear pair response) and the ERP level (associated with the vibrating housing response). The set of decision variables matches macro- (helix and pressure angles) and micro-geometry parameters (amounts and roll lengths of tip relief).
The 3D Pareto front resulting from the multi-objective optimization confirms that the objectives related to the improvement of energy efficiency and vibroacoustic performance are antagonistic. Nevertheless, a significant improvement of the efficiency is possible without degrading the vibroacoustic performance much. Otherwise, the correlation between the gear dynamic response and the ERP level is observed only on the side of the Pareto front corresponding to power losses minimization. On the other side, the analyse of the frequency response function which relates the dynamic mesh force and the housing vibration shows that the optimization of ERP level is not equivalent to the minimization of the gear transmission error fluctuation. These results underline the interest of modelling the whole gear unit to optimize its efficiency and NVH behaviour.
Acknowledgments
The authors are indebted to the French National Research Agency (ANR) and to the institute Carnot Ingénierie@Lyon for their support and funding.
References
- H. Xu, A. Kahraman, N.E. Anderson, D.G. Maddock, Prediction of mechanical efficiency of parallel-axis gear pairs, ASME J. Mech. Des. 129, 58–68 (2007) [Google Scholar]
- D. Miler, M. Hoic, Optimisation of cylindrical gear pair − a review, Mech. Mach. Theory 156, 104156 (2021) [CrossRef] [Google Scholar]
- O. Buiga, C.O. Popa, Optimal mass design of a single-stage helical gear unit with genetic algorithms, Proc. Rom. Acad., Ser. A 13, 243–250 (2012) [Google Scholar]
- T.H. Chong, I. Bae, G.J. Park, A new and generalized methodology to design multi-stage gear drives by integrating the dimensional and the configuration design process, Mech. Mach. Theory 37, 295–310 (2002) [CrossRef] [Google Scholar]
- R.C. Sanghvi, A.S. Vashi, H. Patolia, R.G. Jivani, Multi-objective optimization of two-stage helical gear train using NSGA-II, J. Optim. 2014, 670297 (2014) [Google Scholar]
- Q. Yao, Multi-objective optimization design of spur gear based on NSGA-II and decision making, Adv. Mech. Eng. 11, 1–8 (2019) [Google Scholar]
- S. Padmanabhan, S. Ganesan, M. Chandrasekaran, V. Srinivasa Raman, Gear pair design optimization by genetic algorithm and FEA, in: Proceedings of the International Conference on Frontiers in Automobile and Mechanical Engineering F IEEE, 2010, pp. 396–402 [Google Scholar]
- R. Li, T. Chang, J. Wang, X. Wei, J. Wang, Multi-objective optimization design of gear reducer based on adaptive genetic algorithms, in: International Electronic Conference on Computer Science, 2008, pp. 273–277 [Google Scholar]
- M. Patil, P. Ramkumar, K. Shankar, Multi-objective optimization of the two-stage helical gear box with tribological constraints, Mech. Mach. Theory 138, 38–57 (2019) [CrossRef] [Google Scholar]
- A. Carbonelli, J. Perret-Liaudet, E. Rigaud, A. Le Bot, Particle swarm optimization as an efficient computational method in order to minimize vibrations of multimesh gears transmission, Adv. Acoust. Vib. 2011, 195642 (2011) [Google Scholar]
- M.S. Tavakoli, D.R. Houser, Optimum profile modifications for the minimization of static transmission errors of spur gears, ASME J. Mech. Des. 108, 86–94 (1986) [Google Scholar]
- J.A. Korta, D. Mundo, Multi-objective micro-geometry optimization of gear tooth supported by response surface methodology, Mech. Mach. Theory 109, 278–295 (2017) [CrossRef] [Google Scholar]
- D. Ghribi, J. Bruyère, P. Velex, M. Octrue, M. Haddar, A contribution to the design of robust profile modifications in spur and helical gears by combining analytical results and numerical simulations, ASME J. Mech. Des. 134, 1–9 (2012) [CrossRef] [Google Scholar]
- A. Artoni, M. Gabiccini, M. Guiggiani, A. Kahraman, Multi-objective ease-off optimization of hypoid gears for their efficiency, noise and durability performances, ASME J. Mech. Des. 133, 1–9 (2011) [CrossRef] [Google Scholar]
- C.I.L. Park, Multi-objective optimization of the tooth surface in helical gears using design of experiment and the response surface method, J. Mech. Sci. Technol. 24, 823–829 (2010) [CrossRef] [Google Scholar]
- N. Driot, E. Rigaud, J. Sabot, J. Perret-Liaudet, Allocation of gear tolerances to minimize gearbox noise variability, Acta Acust. United Acust. 87, 67–76 (2001) [Google Scholar]
- E. Ben Younes, C. Changenet, J. Bruyère, E. Rigaud, J. Perret-Liaudet, Multi-objective optimization of gear unit design to improve efficiency and transmission error, Mech. Mach. Theory 167, 104499 (2022) [CrossRef] [Google Scholar]
- ISO 21771, Gears − Cylindrical Involute Gears and Gear Pairs − Concept and Geometry, 2007 [Google Scholar]
- J. Durand De Gevigney, C. Changenet, F. Ville, P. Velex, Thermal modelling of a back-to-back gearbox test machine: application to the FZG test rig, Proc. Inst. Mech. Eng., Part J: J. Eng. Tribol. 226, 501–515 (2012) [CrossRef] [Google Scholar]
- C. Changenet, X. Oviedo-Marlot, P. Velex, Power loss predictions in geared transmissions using thermal networks-applications to a six-speed manual gearbox, J. Mech. Des. Trans. ASME 128, 618–625 (2006) [CrossRef] [Google Scholar]
- P. Velex, M. Maatar, A mathematical model for analyzing the influence of shape deviations and mounting errors on gear dynamic behaviour, J. Sound Vib. 191, 629–660 (1996) [CrossRef] [Google Scholar]
- M. Harrison, Vehicle Refinement: Controlling Noise and Vibration in Road Vehicles, Elsevier, 2004 [Google Scholar]
- M.P. Norton, D.G. Karczub, Fundamentals of Noise and Vibration Analysis for Engineers, Cambridge University Press, 2003 [Google Scholar]
- C. Lesueur, Rayonnement Acoustique des Structures, Eyrolles, Paris, France, 1988 [Google Scholar]
- D. Fritze, S. Marburg, H.J. Hardtke, Estimation of radiated sound power: a case study on common approximation methods, Acta Acust. United Acust. 95, 833–842 (2009) [CrossRef] [Google Scholar]
- S.P. Radzevich, Dudley's Handbook of Practical Gear Design and Manufacture, 2012, pp. 1–878 [Google Scholar]
- ISO 6336, Calculation of Load Capacity of Spur and Helical Gears, 1996 [Google Scholar]
- Y. Yusoff, M.S. Ngadiman, A.M. Zain, Overview of NSGA-II for optimizing machining process parameters, Proc. Eng. 15, 3978–3983 (2011) [CrossRef] [Google Scholar]
- K. Deb, T. Goel, Controlled elitist non-dominated sorting genetic algorithms for better convergence, in: International Conference of Evolutionary Multi-Criterion Optimization, 2001, pp. 67–81 [CrossRef] [Google Scholar]
- B.R. Höhn, K. Michaelis, A. Wimmer, Low loss gears, Am. Gear Manuf. Assoc. Tech. Paper 05FTM 11, 11 (2005) [Google Scholar]
- B.R. Höhn, Improvements on noise reduction and efficiency of gears, Meccanica 45, 425–437 (2010) [CrossRef] [Google Scholar]
- P. Velex, F. Ville, An analytical approach to tooth friction losses in spur and helical gears—influence of profile modifications, J. Mech. Des. 131, 101008 (2009) [CrossRef] [Google Scholar]
Cite this article as: E.B. Younes, E. Rigaud, J. Perret-Liaudet, J. Bruyère, C. Changenet, Optimization of energy efficiency and NVH behaviour of a helical gear unit, Mechanics & Industry 25, 1 (2024)
All Tables
All Figures
|
Fig. 1 Single stage gear unit. |
| In the text | |
|
Fig. 2 Thermal network for the studied single stage gear unit [17]. Numbering of isothermal elements: (1) = ambient air; (2) = upper part of the casing; (3) = lateral part of the casing; (4) = lower part of the casing;(5) = oil sump; (6) and (7) = bearings on pinion's shaft; (8) and (9) = bearings on wheel's shaft; (10) = pinion's shaft; (11) = wheel's shaft; (12) = pinion; (13) = wheel; (14) = meshing zone of gear teeth. |
| In the text | |
|
Fig. 3 Housing meshing. |
| In the text | |
|
Fig. 4 Pareto front of the multi-objective optimization. (*) Reference point. P1, P2, P3, P4: specific points. |
| In the text | |
|
Fig. 5 Decision variables associated to the Pareto front. P1, P2, P3, P4: specific points. |
| In the text | |
Current usage metrics show cumulative count of Article Views (full-text article views including HTML views, PDF and ePub downloads, according to the available data) and Abstracts Views on Vision4Press platform.
Data correspond to usage on the plateform after 2015. The current usage metrics is available 48-96 hours after online publication and is updated daily on week days.
Initial download of the metrics may take a while.