| Issue |
Mechanics & Industry
Volume 22, 2021
|
|
|---|---|---|
| Article Number | 7 | |
| Number of page(s) | 11 | |
| DOI | https://doi.org/10.1051/meca/2020101 | |
| Published online | 08 March 2021 | |
Regular Article
A study on the high-efficiency mixer of the SCR system
1
Kailong High Technology Co., Ltd, Wuxi 214177, PR China
2
Shandong University, Jinan 250061, PR China
* e-mail:: This email address is being protected from spambots. You need JavaScript enabled to view it.
; This email address is being protected from spambots. You need JavaScript enabled to view it.
Received:
16
April
2020
Accepted:
28
December
2020
Abstract
A new mixer for a diesel engine after-treatment system is developed to meet the requirements of China VI emission regulation. As for the structure of the mixer, it is surrounded by spiral blades, and the center is staggered with small blades, which is conducive to the crushing of urea droplets and can make the droplets fully mixed with air, improve the conversion efficiency of nitrogen oxides (NOx) and reduce ammonia leakage. The numerical analysis, engine bench test, and vehicle road test were carried out on the after-treatment system equipped with the new mixer. The numerical calculation results show that the velocity uniformity index of the selective catalytic reduction (SCR) carrier can reach 0.98, as well as the ammonia uniformity can reach 0.95, meanwhile, the low wall film height shows excellent anti-crystallization properties. engine bench test results are consistent with numerical results. The crystallization status of the mixer after the vehicle durability test is acceptable and well performed.
Key words: Mixer / numerical analysis / crystallization risk / experimental test
© K. Lu et al., Hosted by EDP Sciences 2021
 This is an Open Access article distributed under the terms of the Creative Commons Attribution License (https://creativecommons.org/licenses/by/4.0), which permits unrestricted use, distribution, and reproduction in any medium, provided the original work is properly cited.
From July 2021, China VI emission regulation will be implemented widely, and the emission of NOx requires to be less than 0.4 g/(kWh). In order to reduce NOx emission, SCR is widely used in many exhaust gas purification technologies [1,2]. The mixer is an essential part of the SCR after-treatment system. Suitable mixer can thouroughly mix urea droplets with exhaust gas, accelerate evaporation, pyrolysis and hydrolysis rate of urea droplets [3], improve NOx conversion efficiency, reduce ammonia leakage risk which can avoid secondary pollution.
Based on the traditional mixer, Zhang et al. designed a new mixer to improve the performance of the engine at low speed and low load. The mixer has better anti-crystallization performance [4]. Zhang et al. combined with diesel oxidation catalyst (DOC), catalytic diesel particulate filter (CDPF) and SCR technologies to modify pollutant emissions of heavy diesel engines, including NOx conversion efficiency and ammonia leakage, upstream DOC and diesel particulate filter (DPF) reduced particle number (PN) and particulate matter (PM) by an average of 91.6% and 90.9% respectively, while downstream SCR reduced NOx by 85% [5]. Choi et al. used computational fluid dynamics (CFD) technology to carry out simulate analysis on the catalytic converter, and took the eddy static mixer and mixing chamber as the mixing unit, which caused a strong disturbance, had a great impact on the flow characteristics and the decomposition of urea into ammonia and shortened the length of traditional mixing chamber [6]. Zhang Wen-Juan et al. simulated the pyrolysis process after injecting urea solution into the catalytic converter with CFD technology, which was mutually confirmed with the test, and this method was used for SCR structure optimization design [7]. Zheng et al. studied the application of a mixer in the SCR system, which can improve the mixing uniformity and effectively reduce NOx emissions [8]. Zheng et al. made a research on the crystallization phenomenon of SCR, the research showed that when the urea or its by-product deposited on the inner surface of the system (including the wall, mixer, injector shell, and substrate), may lead to high backpressure and material deterioration problems [9]. Park et al. studied the influence of static mixer structure on system pressure loss and mixing uniformity in marine SCR system and found that eddy current mixer had good comprehensive performance after concidering the two [10]. Hasan et al. used the CFD method to study the impact characteristics of urea spray in the mixed chamber, and focused on the influence of wall temperature on the results of urea spray through experiments and simulation methods [11]. Mehdi et al. studied the influence of performance parameters such as velocity uniformity, ammonia uniformity and temperature distribution of catalytic converters in Marine SCR technology.They introduced that the adoption of LSM technology could make SCR system achieve higher urea conversion efficiency [12]. Schmid et al. studied the crystallization process of urea with water droplets. The crystallization process was experimentally studied to understand the growth morphology of crystals under different conditions. The urea crystallization patterns were studied at sub-boiling points with different wettability substrates by using optical and thermal imaging techniques [13].
The structure of SCR mixer has a significant influence on the conversion efficiency [14] and crystallization resistance of the after-treatment system, and the application of traditional mixer in China VI emission stage shows the shortcomings of low conversion efficiency and easy crystallization, as shown in Figure 1. At present, it is urgent to develop a new mixer that can effectively reduce crystallization risk and have high conversion efficiency under the traditional layout structure. The development of this mixer can be used for reference in the design of small size to meet China VI emission regulation. This paper mainly conducts numerical analysis and tests on the developed new mixer. The test is divided into ammonia gas uniformity test, engine bench test, and vehicle road test, mainly to investigate the actual ammonia gas uniformity distribution at the end of the carrier, NOx conversion efficiency, and crystallization situation.
1 Research plan
1.1 The new scheme
This article mainly focused on developing a new mixer that installed in an after-treatment device, made it meet the China VI emission standard, which include DOC, DPF and SCR (as shown in Fig. 2). The new mixer can improve the ammonia uniformity coefficient and overall mixing effect. As shown in Figure 3. The center of the mixer is staggered blades, which are conducive to urea crushing and surrounded by swirling blades, which can make the airflow rotate, enhance the mixing degree of urea and air, reduce the crystallization risk of mixer and the surrounding area, extend the evaporation path and residence time of urea droplets, and improve the evaporation efficiency.
 |
Fig. 2 A common after-treatment system layout on light trucks chassis. |
 |
Fig. 3 New mixer with Special structure. |
1.2 Numerical analysis
In this paper, CFD method was used to evaluate the airflow mixing effect in the upstream exhaust pipe of the SCR. ANSYS ICEM CFD software was used to mesh the computing domain. The flow process was calculated based on the SIMPLE algorithm, and the Realizable k-ε [15] model in turbulence model was selected. Catalyst carriers were treated as a porous medium model. The spray system adopted a discrete phase model (DPM) [16,17], which considered the atomization and evaporation of the urea aqueous solution and component transport [18,19]. The component transport mode was expressed as follows: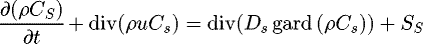 (1)where, ρcs is the mass concentration, cs is the volume concentration, Ds is the component diffusion coefficient, and Ss is the component mass produced by the chemical reaction.
The model consists of the KH (Kelvin-Helmholtz) model and RT (Rayleigh-Taylor) model based on the instability theory of gas-liquid interface disturbance wave. The KHRT model [20,21] was used in the droplet crushing model, and the discrete phase calculation time was 0.1 s, and the single calculation step was 0.1 ms. The KHRT model takes the primary crushing and secondary crushing into account and can well predict the transient process of urea spray. The liquid phase crushing length L is expressed as follows: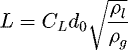 (2)where, CL is a constant, and d0 is the diameter of the nozzle hole.
Only laminar flow was considered when calculating the flow of air in the carrier. Viscosity resistance coefficient and inertial resistance coefficient of the carrier were needed, which we could get from the cold flow back pressure test. The test equipment is shown in Figure 4. Recorded the pressure loss at different flows during the experiment and processed the data according to Darcy law [11,22].
The three-hole conical injection method was selected for the urea liquid jet, and the nozzle (Fig. 5a) was common in the market. Urea droplet size distribution and related data were obtained by testing [23]. Test equipment (Fig. 5b) included an airless jet pump, laser particle size analyzer, urea pipeline, wire harness, etc. Figure 6 showed the measured particle size distribution of urea droplets. The nozzle parameters used in the numerical calculation were shown in Table 1.
The inlet boundary was set as the mass flow inlet, and the outlet was set as the pressure outlet. The diameters of catalytic converter inlet and outlet were both 70 mm. The turbulent kinetic energy value is 5% of the average inlet velocity squared, and the characteristic length is 10% of the diameter of the pipe. The heat transfer effect of the outer wall surface was considered, and the outer wall surface heat transfer coefficient was set to 10 W/m · k. The wall velocity was calculated according to the boundary condition without slippage.
The experimental operating point is selected as shown in Figure 7 below, where point 1 is the low speed torque point under the external characteristic curve of engine. Point 2 is the rated operating point under the external characteristic curve of engine, and point 3 is the low temperature evaluation point (higher than the urea priming temperature) corresponding to the speed of point 1. Point 4 is the low temperature evaluation point at the rated speed. The specific working conditions are shown in the following Table 2.
 |
Fig. 4 Backpressure test system. (a) Catalyst carrier. (b) Backpressure testbench. |
 |
Fig. 5 Testing equipment for nozzle parameters. (a) nozzle. (b) Laser particle size analyzer. |
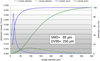 |
Fig. 6 Droplet size distribution. |
Parameters of nozzle.
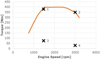 |
Fig. 7 Working conditions. |
Working conditions for calculation.
1.3 Experiments and tests
1.3.1 Ammonia concentration uniformity test
The ammonia uniformity coefficient reflects the NOX conversion efficiency [24]. The accuracy of the numerical calculation was verified by the ammonia concentration uniformity test, and the test was performed with a burner and a gas analyzer (Fig. 8). The test probe was arranged at the outlet of the carrier, and measurement was started after the airflow was stabilized. The probe measured the points which were set, and measured two sets of data, and finally processed the measured data to obtain the ammonia uniformity coefficient.
 |
Fig. 8 Gas analyzer. (a) Schematic diagram of ammonia analyzer. (b) Installation diagram of ammonia analyzer. |
1.3.2 Engine bench test
The layout of the engine bench and the actual installation of after-treatment system are shown in Figure 9. Testing equipment mainly included dynamometer, engine, control system, gas analyzer, etc. The main engine parameters were shown in Table 3. Test conditions were the same as numerical calculation conditions, and the test mainly considered the NOX conversion efficiency and crystallization. The SCR carrier used in the test was coated with an ammonia leak. The more urea sprayed, the higher NOx conversion efficiency, but it also increased ammonia leakage. During the experiment, the equivalent coefficient α related to the urea injection volume was introduced to record the relevant data under different α (0, 0.5, 0.6, 0.7, 0.8, 0.9, 1.0, 1.1, 1.2, 1.3, 1.4, 1.5). The urea injection amount at α = 1.2 was used in the numerical calculation.
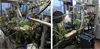 |
Fig. 9 Engine test bench and installation of the after-treatment system. |
Engine parameters.
1.3.3 Vehicle road test
Due to China's vast territory and the emission regulation, the light truck equipped with this device needs to be tested under the climate conditions of temperate zone (Z1), desert area (Z2), tropical area (Z3), subarctic region (Z5). The vehicle at the same time also has to consider the terrain, load factor, urban, rural conditions. Therefore, the light truck equipped with this device will complete the test of the road conditions, as shown in Table 4, and the crystallization of the exhaust system after the test should be checked and recorded.
Vehicle test plan of durable crystallization condition.
2 Numerical calculation results and discussion
2.1 Uniformity coefficient
This section mainly discusses the velocity uniformity and homogeneity of ammonia in front of the SCR carrier. A proper airflow distribution can effectively improve the performance of carrier. So, the velocity uniformity needs to be above 0.98, and the ammonia uniformity needs to be above 0.95. The expression of uniformity index (UI) for evaluating the airflow quality is as follows [25]: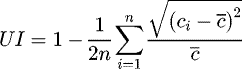 (3)where n is the number of mesh sections; ci
is the value of parameter c in grid i;
(3)where n is the number of mesh sections; ci
is the value of parameter c in grid i;  is the average value of parameter c over the whole section.
2.1.1 Velocity uniformity coefficient
The uniformity coefficient of SCR under each working condition are shown in the Table 5, and the calculated results show that the uniformity coefficients meet the requirement. The uniform distribution of velocity on the front surface of the SCR carrier under different working conditions is shown in Figure 10. The velocity of airflow on the carrier surface is high, and the airflow is evenly distributed, which means that the carrier could be used efficiently.
Velocity uniformity index with Pre-SCR.
 |
Fig. 10 Contours of velocity with Pre-SCR. |
2.1.2 Uniformity coefficient of ammonia
The uniformity coefficient of ammonia gas at the front end of SCR under various working conditions is shown in Table 6, and the calculated results are qualified. The new mixer can fully mix urea particle with exhaust gas to improve NOX conversion efficiency. The uniform distribution of ammonia is shown in Figure 11. It can be seen from the figure that the gradient of ammonia distribution is small, and the distribution of ammonia is relatively uniform. Due to different working conditions, ammonia distribution positions are also different, and the maximum distribution positions are not consistent but acceptable.
A statistical analysis (as shown in Fig. 12) of the above calculation results shows that the calculated values are all higher than 0.95. The ammonia uniformity distribution at the front surface of the SCR carrier shows that under the action of the mixer, the airflow is evenly distributed, which improves the performance of the carrier. It plays a positive role in promoting the full use of the carrier and meets the requirements of high-velocity uniformity of the solution.
Ammonia uniformity index with Pre-SCR.
 |
Fig. 11 Contours of ammonia distribution with Pre-SCR. |
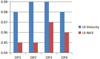 |
Fig. 12 Statistics of uniformity index under four operating points. |
2.2 Crystallization risk analysis
The formation of urea crystals is closely related to air temperature, flow rate, urea injection system, and other factors. Urea aqueous solution is sprayed and atomized by the nozzle and then hits the wall, and some droplets will adhere to the specific surface to form a wall film. In this section, the location and thickness of the wall film were taken into account, and the crystallization risk was comprehensively evaluated in combination with the wall temperature near the wall film and the flow velocity near the wall.
2.2.1 Distribution of wall film
The analysis results show that the wall film is mainly concentrated in the mixer and the nearby pipeline, and there is also a small part of the wall film at the connection between the nozzle holder and the pipeline, as shown in Figure 13. There is more wall film on the swirl blades in the mixer and less wall film on the staggered small blades. There is also a small amount of wall film at the connection between the mixer and the pipeline. When the mixer is installed with the nozzle holder, there is a dead zone of flow between the two, where urea droplets are easy to stay and form a wall film. The wall film on the pipeline is mainly concentrated at the bottom of the pipeline, and there are many wall films near the mixer. Some urea droplets are less affected by the airflow, and drip at the bottom of the pipeline and gather to form a wall film.
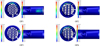 |
Fig. 13 Distribution of wall film. |
2.2.2 Temperature distribution at the wall film
The temperature distribution of the mixer and the central section of the nozzle holder under various working conditions are shown in Figure 14. The temperature is lower in the part position of center staggered blades and swirling blades than that of other parts. Lower temperature position is different under different working conditions. Combined with the wall film location analysis, the wall film thickness at the lower temperature position is larger. The temperature is lower at the connection between the nozzle seat and the pipeline, where the wall film thickness is large. The temperature at the bottom of the pipeline is higher than the connection between the nozzle holder and the pipeline, where the wall film thickness is relatively large. The temperature at the center of the nozzle holder is lower than other positions, but the temperature of the nozzle holder wall is higher than the center, the wall film thickness on the wall is minimal, which can also be seen from the Figure 13.
According to the crystallization evaluation criteria [26] and the calculated wall film thickness and temperature, the wall film thickness at the connection between the nozzle holder and the pipeline is large, but the temperature is high, so the crystallization risk is judged to be medium. The wall film thickness on the pipeline is small, so the crystallization risk is relatively low, and the crystallization risk at the mixer is medium. The crystallization risk assessment of the mixer under each calculation condition is shown in Table 7.
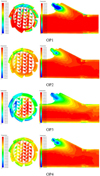 |
Fig. 14 Temperature distribution at the mixing part. |
Crystallization risk at the mixer.
3 Test results and discussion
3.1 Uniformity test of ammonia
The measurement point is located between two SCR carriers, as shown in Figure 15. The two measurement lines are perpendicular to each other by 90°. Then calculate the uniformity value according to the formula 4 which is corresponding to the formula 3: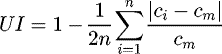 (4)where n is the number of positions, ci is the concentration at position i, cm is the average concentration.
The measured results are shown in Table 8. The measured results are the comparison data of two experiments, and the mean value of the two experimental data is taken as the final result.
We can conclude that from the comparison between experimental results and simulation results, in terms of uniformity, the experimental results are very close to the simulation results. Under working conditions 1 and 2, the ammonia uniformity coefficient reached 0.95. Under working conditions 3 and 4, the ammonia uniformity coefficient reached 0.97. Combined with the simulation analysis, it is concluded that the mixing time of urea and airflow is longer in low flow conditions than in high flow conditions, which is more conducive to improving the uniformity coefficient of ammonia.
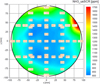 |
Fig. 15 Test points of ammonia uniformity. |
Simulation and experimental data.
3.2 Conversion efficiency test
The conversion efficiency curve of the after treatment device under various working conditions is shown in Figure 16. With the increase value of α, the urea injection volume increases, and the NOX conversion efficiency gradually improves. The original NOx emission of the engine used in the test is 4 g/(kWh). When the NSR parameter of α is 1.2, the NOX conversion efficiency under all working conditions can reach above 0.96. Excessive urea will lead to increased ammonia leakage and secondary pollution.
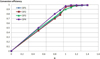 |
Fig. 16 Conversion efficiency of NOX. |
3.3 Crystallization risk assessment
When crystallization performance evaluated, the injection coefficient is set to 1, and the engine needs to run as long as 10 h under corresponding conditions. Remove the nozzle holder after the test, the crystallization performance under different conditions is shown in Figure 17 by endoscopy. The crystallization at operation 1, 2 and 3 can hardly be observed, under the condition of operation 4, the crystallization mainly concentrated in the upper area of the mixer, focus on the swirling blade and the small leaf. The results of bench test are consistent with those of numerical calculation. Then, using an electron microscope and X-ray fluorescence spectrometer to figure out what material does this crystal is [21,27,28].
Electron microscope (Fig. 18, FEI Nova Nano SEM 450) was used to observe the microstructure of the crystals, and the microscale of the crystals was mainly 5–10 µm at 5000 times magnification, as shown in Figure 19.
Taking a small amount of the crystal and analyze it by X-ray fluorescence spectrometer (as shown in Fig. 20, Rigaku − ZSX Primus IV). Comparing the results with standard urea composition analysis, we found that the spectrums are almost the same (as shown in Fig. 21), so it can be concluded that crystallization caused at operation condition 4 is urea, which can be decomposed at the regeneration condition.
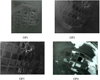 |
Fig. 17 Crystallization experiment. |
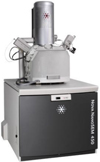 |
Fig. 18 Electron microscope. |
 |
Fig. 19 The microstructure of urea crystals. |
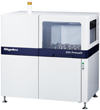 |
Fig. 20 X-ray fluorescence spectrometer. |
 |
Fig. 21 Spectrum comparison of deposits and urea crystal. |
3.4 Vehicle road test
Compared with the stable environmental conditions of the bench test, the actual road operating conditions are more complicated. Experiments in different external environments can better verify the performance stability of the product under complex conditions. The product loading diagram is shown in Figure 22. It can be seen from the data of different road test experiments that the surface of the mixer is slightly crystallized in different external environments (as shown in Tab. 9). Under the conditions of the Z5 test environment, the mixer surface crystallinity is more than that of the other three test environments. Considering the low temperature of Z5 test environment, urea is easy to precipitate on the wall surface and form crystallization under this environment. After the regeneration operation, the crystals in each test environment are dissolved, and the product performance meets the test requirement.
 |
Fig. 22 The layout of the after-treatment system on a vehicle. |
Crystallization status of the mixer after the vehicle durability test.
4 Conclusion
This paper studied a new, high-efficient mixer of the SCR system in light trucks. In particular, the application of the numerical calculation method for evaluating the design rationality of mixer and the mixing performance under the structural arrangement and the risk evaluation of crystallization mainly focused on the velocity uniformity index, ammonia uniformity index, and wall film thickness, and local temperature relationship. Engine bench test and vehicle road test verified the conversion efficiency and crystallization.Through the above research, we can reasonably draw the following conclusions:
-
According to the numerical calculation results, the developed new mixer can make the velocity uniformity coefficient of the SCR carrier front surface reach 0.98, and the uniformity coefficient of ammonia reaches 0.95, which can effectively improve the NOX conversion efficiency, reduce crystallization risk, and keep ammonia leakage at a low level.
-
The measurement of the microstructure of urea crystals in the bench experiment shows that the crystal's microscopic scale is mainly 5–10 µm, and the spectra of the crystals caused by working condition 4 are nearly consistent with the spectra of pure urea crystals. Thus, it can be concluded that the crystalline components under working condition 4 are urea crystals.
-
The road test results of the whole vehicle show that the new mixer has good anti-crystallization performance under the actual road test conditions, and the crystals disappeared after the regeneration process, which can meet the market application requirements and the bench test.
References
- M. Martinjak, Numerical simulation of Selective Catalytic Reduction (SCR) system, Bologna: Faculty of Mechanical Engineering and Naval Architecture, Zagreb University (2016) [Google Scholar]
- A. Capetillo, F. Ibarra, Multiphase injector modeling for automotive SCR systems: a full factorial design of experiment and optimization, Comput. Math. Appl. 74 , 188–200 (2017) [Google Scholar]
- G. Zheng, M.K. Sampath, W. Alcini et al. Design improvements of urea SCR mixing for medium-duty trucks, SAE Paper. Detroit, Michigan, USA, 2013, 2013-01-1074 [Google Scholar]
- C. Zhang, C. Sun, M. Wu et al. Optimization design of SCR mixer for improving deposit performance at low temperatures, Fuel 237 , 465–474 (2019) [Google Scholar]
- Y. Zhang, D. Lou, P. Tan, Z. Hu, Experimental study on the particulate matter and nitrogenous compounds from diesel engine retrofitted with DOC + CDPF + SCR, Atmos. Environ. 177 , 45–53 (2018) [Google Scholar]
- C. Choi, Y. Sung, G.M. Choi, D.J. Kim, Numerical analysis of NOx reduction for compact design in marine urea-SCR system, Int. J. Nav. Archit. Ocean Eng. 7 , 1020–1033 (2015) [Google Scholar]
- Z. Wen-juan, S. Shi-jin, D. Hong-yi, W. Zhi, W. Jian-xin, 3d modeling of flow, spray of reductant and surface chemical reaction in diesel urea scr-nox catalytic converter, Trans. CSICE 25 , 433–438 (2007) [Google Scholar]
- G. Zheng, G. Palmer, G. Salanta, A. Kotrba, Mixer Development for Urea SCR Applications; No. 2009-01-2879; SAE Technical Paper: Warrendale, PA, USA, 2009 [Google Scholar]
- G. Zheng, A. Fila, A. Kotrba, R.A. Floyd, Investigation of urea deposits in urea SCR systems for medium and heavy duty trucks; SAE Technical Paper: Warrendale, PA, USA, 2010 [Google Scholar]
- T. Park, Y. Sung, T. Kim, I. Lee, G. Choi, D. Kim, Effect of static mixer geometry on flow mixing and pressure drop in marine SCR applications, Int. J. Nav. Archit. Ocean Eng. 6 , 27–38 (2014) [Google Scholar]
- S.G.M. Hasan, W.M.K. Aditya, L.O. Taeck, Investigation of urea-water solution spray impingement on the hot surface of automotive SCR system, J. Mech. Sci. Technol. 32 , 2935–2946 (2018) [Google Scholar]
- G. Mehdi, S. Zhou, Y. Zhu et al., Numerical investigation of SCR mixer design optimization for improved performance, Processes 7 , 168 (2019) [Google Scholar]
- J. Schmid, I. Zarikos, A. Terzis, N. Roth, B. Weigand, Crystallization of urea from an evaporative aqueous solution sessile droplet at sub-boiling temperatures and surfaces with different wettability, Exp. Therm. Fluid Sci. 91 , 80–88 (2018) [Google Scholar]
- L. Tan, P. Feng, S. Yang, Y. Guo, S. Liu, Z. Li, CFD studies on effects of SCR mixers on the performance of urea conversion and mixing of the reducing agent, Chem. Eng. Process. Process Intensif. 123 , 82–88 (2018) [Google Scholar]
- X. Tian, Y. Xiao, W. Zhang, Numerical simulation of urea aqueous solution injection process in a selective catalytic reduction system, Bioinformatics and Biomedical Engineering (iCBBE), 2010 4th International Conference on. IEEE, 2010 [Google Scholar]
- M. Börnhorst, O. Deutschmann, Single droplet impingement of urea water solution on a heated substrate, Int. J. Heat Fluid Flow 69 , 55–61 (2018) [Google Scholar]
- M. Börnhorst, J. Amsler et al., Thermodynamics and reaction mechanism of urea decomposition, Phys. Chem. Chem. Phys. 21, 16785–16797 (2019) [PubMed] [Google Scholar]
- T.J. Wang, S.W. Baek, S.Y. Lee, D.H. Kang, G.K. Yeo, Experimental investigation on evaporation of urea‐water‐solution droplet for SCR applications, AIChE J. 55 , 3267–3276 (2009) [Google Scholar]
- F. Birkhold, U. Meingast, P. Wassermann, O. Deutschmann, Modeling and simulation of the injection of urea-water-solution for automotive SCR DeNOx-systems, Appl. Catal. B Environ. 70 , 119–127 (2007) [CrossRef] [Google Scholar]
- D. Kuhnke, Spray/wall interaction modelling by dimensionless data analysis, Shaker: Düren, Germany, 2004 [Google Scholar]
- H. Ström, A. Lundström, B. Andersson, Choice of urea-spray models in CFD simulations of urea-SCR systems, Chem. Eng. J. 150 , 69–82 (2009) [Google Scholar]
- Y. Liao, P.D. Eggenschwiler, R. Furrer, M. Wang, K. Boulouchos, Heat transfer characteristics of urea-water spray impingement on hot surfaces, Int. J. Heat Mass Transf. 117 , 447–457 (2018) [Google Scholar]
- J. Oh, K. Lee, Spray Characteristics of a urea solution injector and optimal mixer location to improve droplet uniformity and NOx conversion efficiency for selective catalytic reduction, Fuel 119 , 90–97 (2014) [Google Scholar]
- K.W. Ku, J.G. Hong, C.W. Park et al., Effects of various factors on the conversion efficiency of urea solution in a urea selective catalytic reduction system, Energy Fuels 28 , 5959–5967 (2014) [Google Scholar]
- T.L. Mckinley, A.G. Alleyne, C.F. Lee, Mixture non-uniformity in SCR systems: Modeling and uniformity index requirements for steady-state and transient opera-tion, SAE Paper. Detroit, Michigan, USA, 2010, 2010-01-0883 [Google Scholar]
- C. Zhao, D. Lou, Y. Zhang et al., Application study on a new hybrid canning structure of after-treatment system for diesel engine, MDPI 13 , 734 (2020) [Google Scholar]
- T.O. Lockyer, B.A. Reid, G.K. Hargrave, P. Gaynor, J. Wilson, Optical investigation on the ability of a cordierite substrate mixing device to combat deposits in SCR dosing systems, SAE Technical Paper: Warrendale, PA, USA, 2015 [Google Scholar]
- A.M. Bernhard, D. Peitz, M. Elsener et al., Hydrolysis and thermolysis of urea and its decomposition byproducts biuret, cyanuric acid and melamine over anatase TiO2, Appl. Catal. B Environ. 115–116 , 129–137 (2012) [Google Scholar]
Cite this article as: K. Lu, D. Liu, Y. Wu, S. Liu, S. Bai, A study on the high-efficiency mixer of the SCR system, Mechanics & Industry 22, 7 (2021)
All Tables
All Figures
 |
Fig. 1 Traditional SCR mixer structure. |
| In the text | |
|
Fig. 2 A common after-treatment system layout on light trucks chassis. |
| In the text | |
|
Fig. 3 New mixer with Special structure. |
| In the text | |
|
Fig. 4 Backpressure test system. (a) Catalyst carrier. (b) Backpressure testbench. |
| In the text | |
|
Fig. 5 Testing equipment for nozzle parameters. (a) nozzle. (b) Laser particle size analyzer. |
| In the text | |
|
Fig. 6 Droplet size distribution. |
| In the text | |
|
Fig. 7 Working conditions. |
| In the text | |
|
Fig. 8 Gas analyzer. (a) Schematic diagram of ammonia analyzer. (b) Installation diagram of ammonia analyzer. |
| In the text | |
|
Fig. 9 Engine test bench and installation of the after-treatment system. |
| In the text | |
|
Fig. 10 Contours of velocity with Pre-SCR. |
| In the text | |
|
Fig. 11 Contours of ammonia distribution with Pre-SCR. |
| In the text | |
|
Fig. 12 Statistics of uniformity index under four operating points. |
| In the text | |
|
Fig. 13 Distribution of wall film. |
| In the text | |
|
Fig. 14 Temperature distribution at the mixing part. |
| In the text | |
|
Fig. 15 Test points of ammonia uniformity. |
| In the text | |
|
Fig. 16 Conversion efficiency of NOX. |
| In the text | |
|
Fig. 17 Crystallization experiment. |
| In the text | |
|
Fig. 18 Electron microscope. |
| In the text | |
|
Fig. 19 The microstructure of urea crystals. |
| In the text | |
|
Fig. 20 X-ray fluorescence spectrometer. |
| In the text | |
|
Fig. 21 Spectrum comparison of deposits and urea crystal. |
| In the text | |
|
Fig. 22 The layout of the after-treatment system on a vehicle. |
| In the text | |
Current usage metrics show cumulative count of Article Views (full-text article views including HTML views, PDF and ePub downloads, according to the available data) and Abstracts Views on Vision4Press platform.
Data correspond to usage on the plateform after 2015. The current usage metrics is available 48-96 hours after online publication and is updated daily on week days.
Initial download of the metrics may take a while.