Fig. 15
Download original image
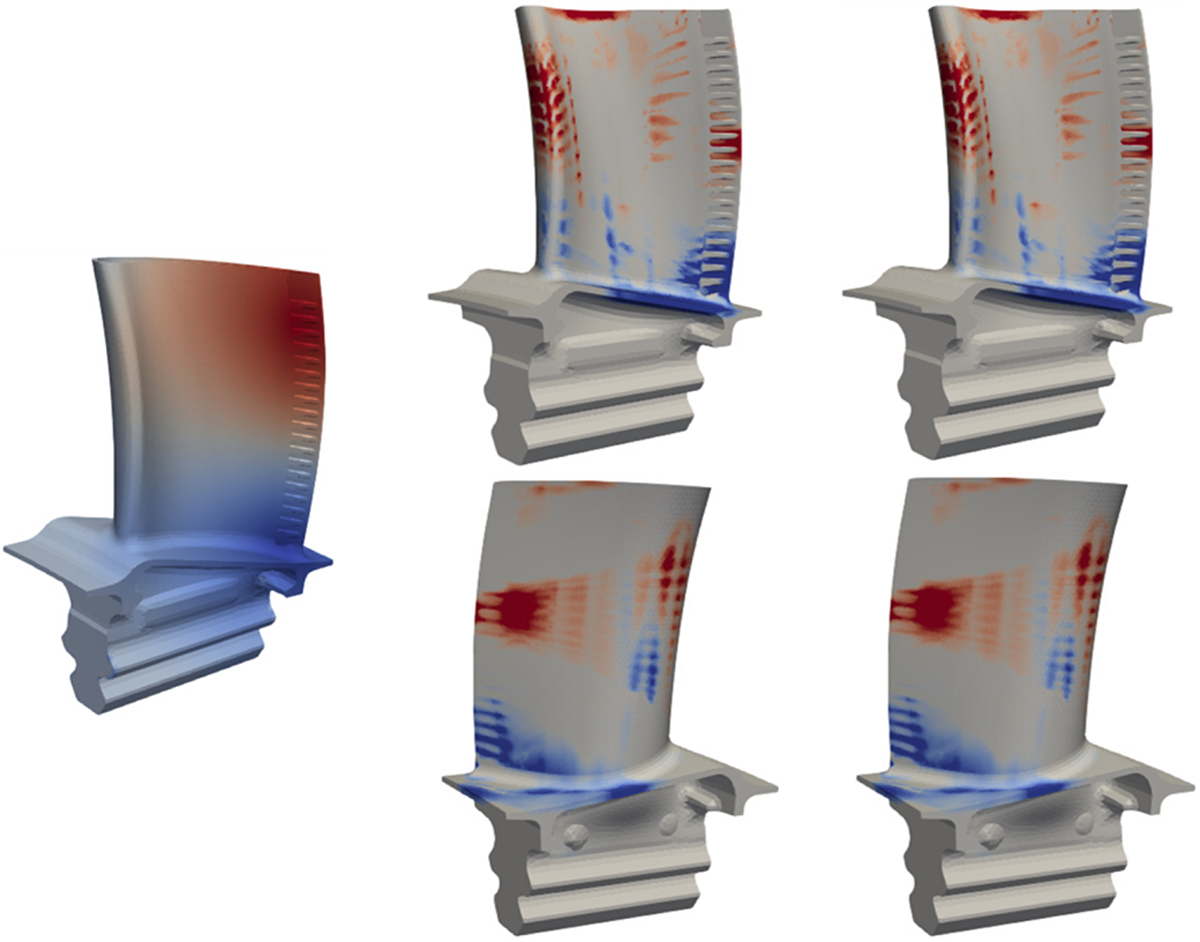
Comparison between high-fidelity predictions (middle column) and ROM-net’s predictions (right-hand column). The field on the left represents the difference between the current temperature field (belonging to cluster 1) and the reference one. The other fields correspond to the increments of the quantity of interest
![]() with respectto its reference state obtained with the reference temperature field.
with respectto its reference state obtained with the reference temperature field.
Current usage metrics show cumulative count of Article Views (full-text article views including HTML views, PDF and ePub downloads, according to the available data) and Abstracts Views on Vision4Press platform.
Data correspond to usage on the plateform after 2015. The current usage metrics is available 48-96 hours after online publication and is updated daily on week days.
Initial download of the metrics may take a while.