Fig. 7
Download original image
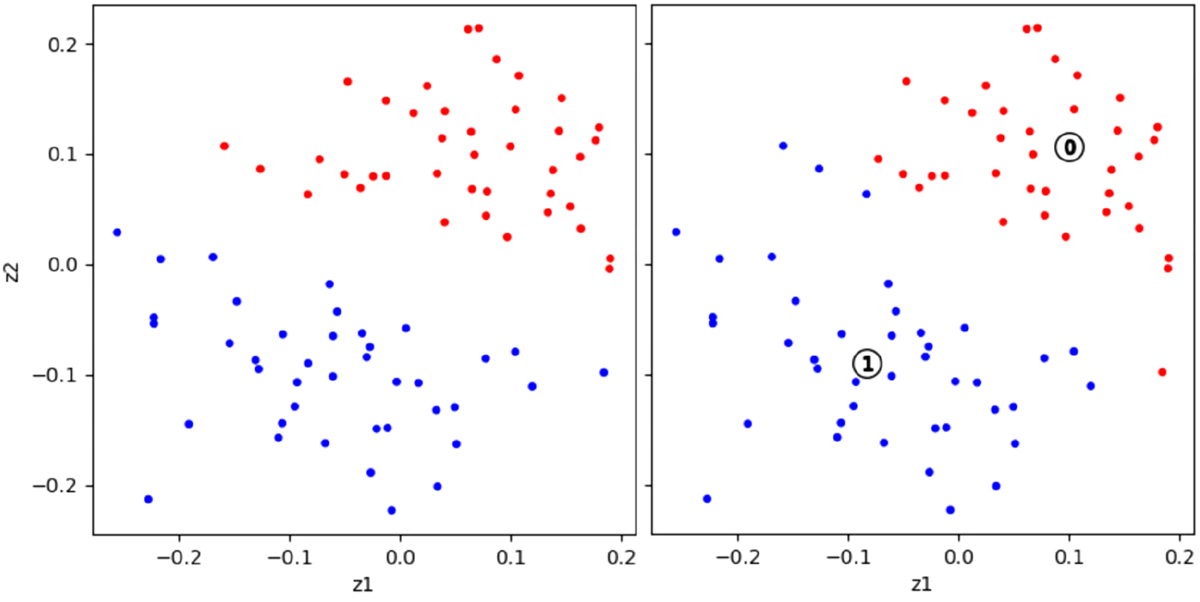
MDS representation of the clustering results using the ROM-oriented dissimilarity measure on the quantity of interest ![]() (goal-oriented variant). On the left, the colors correspond to the expected clusters. On the right, the colors correspond to the clusters identified by the clustering algorithm. The positions of the labels 0 and 1 coincide with the positions of the clusters’ medoids. The MDS relative error
ς(Z0 ; δ)∕ς(0;δ) is 12%.
(goal-oriented variant). On the left, the colors correspond to the expected clusters. On the right, the colors correspond to the clusters identified by the clustering algorithm. The positions of the labels 0 and 1 coincide with the positions of the clusters’ medoids. The MDS relative error
ς(Z0 ; δ)∕ς(0;δ) is 12%.
Current usage metrics show cumulative count of Article Views (full-text article views including HTML views, PDF and ePub downloads, according to the available data) and Abstracts Views on Vision4Press platform.
Data correspond to usage on the plateform after 2015. The current usage metrics is available 48-96 hours after online publication and is updated daily on week days.
Initial download of the metrics may take a while.