Fig. 8
Download original image
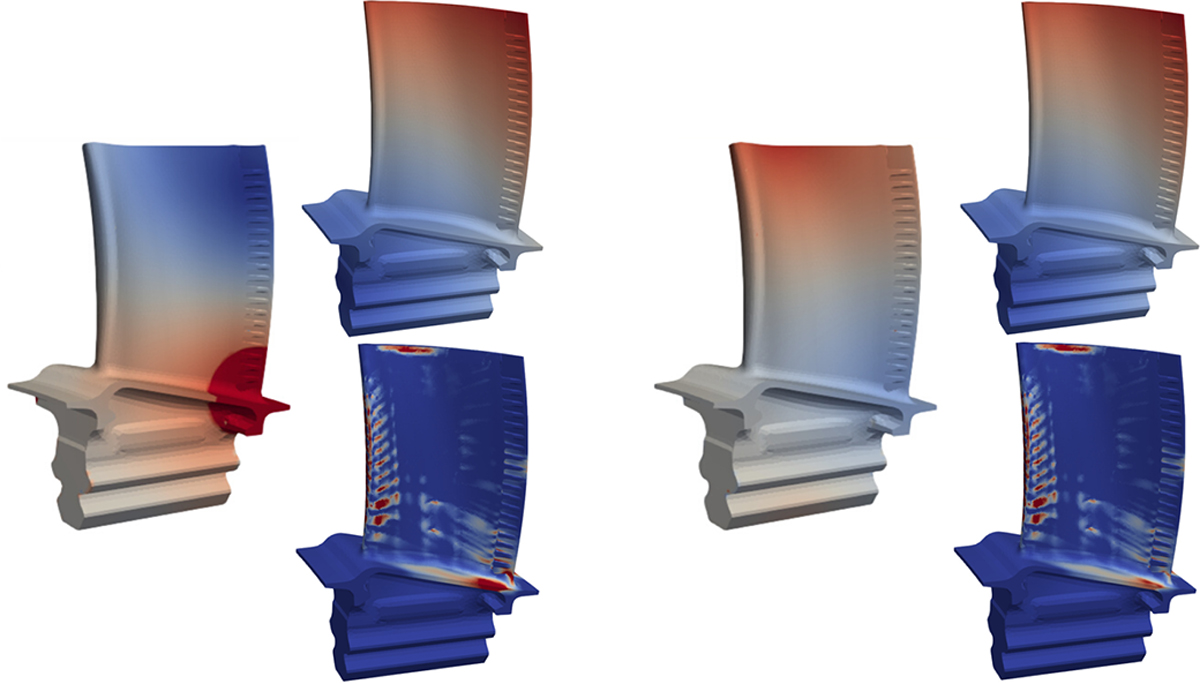
The 3 fields on the left correspond to the medoid of cluster 0, and those onthe right correspond to the medoid of cluster 1. The fields in the first and the third columns show the differences between the medoids’ temperature fields and the reference temperature field Tref
(the scale istruncated for the first field). The second and the fourth columns show the displacement magnitude field
![]() (top) and the quantity of interest
(top) and the quantity of interest ![]() (bottom).
(bottom).
Current usage metrics show cumulative count of Article Views (full-text article views including HTML views, PDF and ePub downloads, according to the available data) and Abstracts Views on Vision4Press platform.
Data correspond to usage on the plateform after 2015. The current usage metrics is available 48-96 hours after online publication and is updated daily on week days.
Initial download of the metrics may take a while.