Open Access
Fig. 9
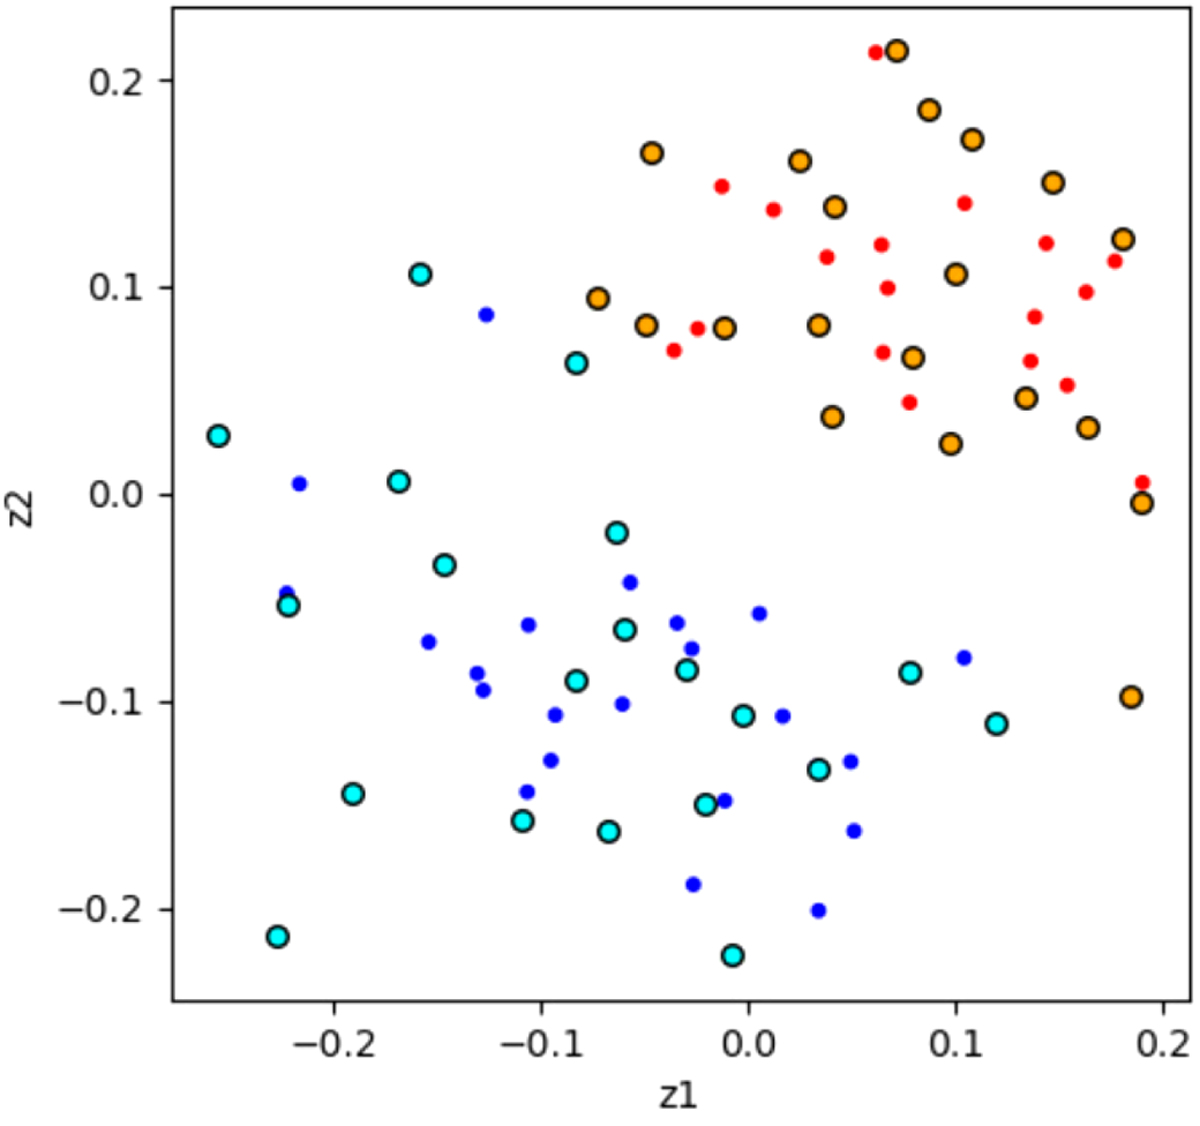
Download original image
MDSrepresentation of the clustering results. Orange points represent the snapshots selected for cluster 0, while the light blue points represent the snapshots selected for cluster 1. For each cluster, the snapshots are selected by a maximin procedure starting from the medoid.
Current usage metrics show cumulative count of Article Views (full-text article views including HTML views, PDF and ePub downloads, according to the available data) and Abstracts Views on Vision4Press platform.
Data correspond to usage on the plateform after 2015. The current usage metrics is available 48-96 hours after online publication and is updated daily on week days.
Initial download of the metrics may take a while.