| Issue |
Mechanics & Industry
Volume 27, 2026
Artificial Intelligence in Mechanical Manufacturing: From Machine Learning to Generative Pre-trained Transformer
|
|
|---|---|---|
| Article Number | 9 | |
| Number of page(s) | 15 | |
| DOI | https://doi.org/10.1051/meca/2026002 | |
| Published online | 05 March 2026 | |
Original Article
Mining user behavior patterns based on reinforcement learning algorithm to optimize service robot interaction strategy
Shanxi University of Finance and Economics, Taiyuan 030006, Shanxi, PR China
* e-mail: This email address is being protected from spambots. You need JavaScript enabled to view it.
Received:
21
July
2025
Accepted:
5
January
2026
Abstract
In order to resolve the challenges of reduced adaptability and generalization stemming from complicated user behavior and sparse feedback in service robot interactions, this paper presents a reinforcement learning-based approach to user behavior pattern mining and policy optimization. This approach integrates Bayesian belief updates and automata learning with counterexamples to unify intent modeling and policy iteration: dynamic intent reasoning promotes multi-scale exploration under sparse rewards; and counterexample reasoning reconstructs the rewards function to bolster policy generalization. Experiments revealed that the method led to mean latency standard deviation of 0.031, a task completion rate was 78.14%, and behavior recognition accuracy 0.9, which can contribute to more capable policies and improve user satisfaction, while providing a reference for the design of complex interaction strategies.
Key words: Service robot interaction / reinforcement learning / user behavior pattern modeling / dynamic intent recognition / strategy adaptive optimization
© M. Guo and Z. Feng, Published by EDP Sciences 2026
 This is an Open Access article distributed under the terms of the Creative Commons Attribution License (https://creativecommons.org/licenses/by/4.0), which permits unrestricted use, distribution, and reproduction in any medium, provided the original work is properly cited.
1 Introduction
Robots that provide services are slowly being incorporated into everyday life, and their interactive ability will directly influence how efficient a task can be accomplished and the resulting user experience [1,2]. Nevertheless, user behavior incorporates a high level of uncertainty in its execution, the feedback from the human user is potentially sparse and slow, and the intent can change from moment to moment with the scene in which the robot is present. This makes the use of traditional rules or static strategies hard to adapt to for another scene parameter, making it difficult to transfer to scene parameters, or for a task to be performed over time. Therefore, an interactive modeling mechanism that can adaptively optimize in uncertain environments is needed to allow robots to make adjustments dynamically based on the interactions they have experienced previously, maintain stability and safety. Recently, behavioral modeling [3,4] has combined data-driven with reinforcement learning to extract user preferences and intent evolution from an interactive experience. Policy gradient [5,6], inverse reinforcement learning [7], and self-supervised learning [8,9] can enhance personalization for policy, although they are typically reliant upon a considerable amount of labeling or reward design, making it difficult to cope with diverse unstructured behaviors. In the case that interactions continue over time, policies can be prone to match or mismatch and there remains a challenge to balance safety and performance.
In this paper, we provide an interactive policy optimization framework that combines reinforcement learning with structural reasoning to offer a unified model of changing user intent, sparse feedback, and complex behavioral structures. The framework develops a dynamic belief space using Bayesian inference to capture changes in user goals while minimizing the chances of a failure policy based on fixed intent assumptions. In sparse feedback scenarios, a multi-timescale value estimation network is employed to balance short-term adjustments with long-term benefits, while a counterexample-based automatic reasoning module is presented to learn the user preference structure by using failure samples from the environment, achieving unsupervised modeling of the potential reward function. The experiments verify the benefits of this approach in terms of accuracy of user intent modeling, adaptability of the behavior policy, and task performance.
2 Related work
In recent years, service robots have been widely utilized in healthcare [10,11], tour guidance [12,13], and intelligent companion-like services [14,15] by changing from prescribed interaction strategies to data-driven modeling techniques. Previous research is largely focused on task-related human-robot interactions [16,17], natural language understanding [18,19], and multimodal fusion [20,21], but they largely failed to deal with dynamic change in user state, often lacking generalization and adaptation capacity. Modeling methodologies such as Hidden Markov Models [22,23], Graph Neural Networks [24,25], and attention mechanisms [26] are capable of capturing temporal dependencies, but these methods suffer from response time lag and modelling mismatch in real unstructured human interactions. Reinforcement Learning remains an ideal solution for optimizing decisions and has been applied in personalized interaction and task planning [27–30] however, it suffers from challenges related to sparse feedback or dynamic changes in intent: fixed policy assumptions are often subject to exploitation and performance degradation [31,32].Though inverse reinforcement learning or potential reward design could address the sparsity issue, they depend on human experience and are unable to generalize well. Some research work has attempted to model agent's rewards or anticipate dynamically changing intentions, but they have not linked to Bayesian uncertainty quantification or dynamic model updating, which can cause quick error accumulation. In this paper, we propose policy-enhanced behavior pattern mining method, using Bayesian inference and counterexample automata, to improve dynamic modeling and adaptability.
3 Reinforcement learning driven user behavior modeling and interaction strategy optimization
3.1 Problem definition and framework design
The optimization of the service robot interaction strategy is formalized as a Markov decision process, defined as a five-tuple (S, A, T, R, γ), where S represents the state space, A represents the action space, T is the state transition function, R is the immediate reward function, and γ is the discount factor.
The state space S comprises heterogeneous multi-source observation information, including three types of feature vectors: user behavior representations, robot internal state encodings, and contextual interaction histories. The user behavior part consists of voice emotion embedding, facial action units, and current semantic input embedding. The robot state includes the previous round of action execution identification, system confidence, physical posture sensor information, and other relevant data. The interaction history uses a sliding window mechanism to construct a time-series representation with a window length of 10. A GRU (Gated Recurrent Unit) encoder is employed to compress it into a fixed-dimensional state summary.
The action space A includes a set of multimodal output actions, covering language generation, body movements, interface feedback, and combined strategy actions. Each action is mapped to a unique hot vector in the strategy representation and is uniformly processed and mapped to a vector representation by the embedding layer:
 (1)
(1)
Wa is the learnable action embedding matrix.
The state transition function T is not explicitly modeled; rather, it is generated by the dynamic evolution of the interactive environment, and the strategy-learning stage is indirectly reflected in the experience interaction trajectory. The reward function is designed based on indirect feedback signals and does not rely on the user's explicit rating label:
 (2)
(2)
The calculation of instant rewards relies on three-dimensional signals: the task success indicator 1succ, the emotional positivity score femo(t) in voice response, and the system operation load change ΔLoad(t). Multi-source feedback signals are linearly combined and weighted to form a sparse reward value. Sparsity enhancement strategies include state-matching triggers (a non-zero reward is triggered when the state vector enters a specific interaction key area) and behavior-efficiency rewards (the penalty weight accumulates and increases when the user does not operate continuously).
In this paper, the emotional positivity score femo(t) is derived through multimodal fusion. First, rhythm and timbre features (such as fundamental frequency/pitch, energy, speaking rate, and MFCC energy envelope) are extracted from speech, and a pre-trained emotion classifier outputs the speech emotion confidence score. Simultaneously, action unit intensities and expression category probabilities are extracted from facial videos. In the semantic channel, a semantic encoder generates a probability estimate of the text's emotional tendency (positive/negative/neutral). These three confidence scores are first normalized and calibrated (by removing the individual neutral baseline and mapping them to the 0–1 range). Then, they are weighted and fused according to the modal confidence scores (the default recommended empirical weighting is speech:face: semantic = 0.5:0.3:0.2, or a dynamic confidence adjustment based on signal-to-noise ratio/occlusion ratio can be used). Finally, the fused score is subjected to short-term smoothing and baseline drift correction (using a sliding window of 3–5 frames or equivalent exponential smoothing) to reduce the impact of transient noise. When a modality is missing, the weights are renormalized based on the remaining modalities. Before system deployment, offline calibration is performed using an annotated sentiment dataset, and a small amount of user-level fine-tuning is optionally performed to ensure the consistency and interpretability of femo(t) across different populations and environments.
The overall strategy optimization structure is based on the Actor-Critic architecture design. The strategy representation network accepts state inputs and outputs an action probability distribution. Strategy function:
 (3)
(3)
embed(It) is the embedding vector of the intent variable.
In equation (3), we concatenate the intent embedding vector embed(It) with the state vector st to produce a joint representation of [st; embed(It)] that is fed into the policy network fθ. This allows the policy to perceive both the environment and the user's intent simultaneously, ultimately leading to more personalized and accurate decision-making. The value function module is used to assess the expected reward of the state-action pair:
 (4)
(4)
The state input module integrates information from multimodal observations and normalizes them before processing them using a three layer fully connected policy network which outputs action probabilities that have been normalized using softmax. The network includes a type of learning called Bayesian belief update, which employs particle filtering to quantify the posterior distribution of discrete user intentions (or hypothesis) to model uncertainty.
 (5)
(5)
 indicates the set of particles where each particle represents an intent hypothesis. After resampling and updating the particles based on the likelihood function, the overall user intent posterior embedding is combined into the state encoding and provided as additional input to the policy network to accomplish the dynamic adjustment from state to policy.
Within this framework, the observation likelihood P(Ot | It) is learned using a parameterized neural network. The system concatenates multimodal observations into a high-dimensional vector and uses the neural network to output scores indicating the confidence of particle matching, representing the likelihood via softmax. The likelihood network and policy network use a shared encoder architecture, but the weights are independent. Furthermore, using end-to-end training through maximizing the log-likelihood, it captures multimodal intent patterns adaptively, thus providing greater flexibility and accuracy compared to prior distributions. The system is broken into three modules, state fusion, policy mapping, and intent inference, to create a joint decision-making structure that enhances adaptability to dynamically change tasks.
3.2 Bayesian dynamic belief update mechanism for user intention
User intent modeling uses a hidden state framework and dynamic Bayesian inference via particle filtering. Each particle signifies a possible user intent, and the weight of that particle is updated over time to reflect the posterior probability. In the initial state of the system, particles are distributed uniformly in the state space with equal weights, and a moderate number of particles is established to reach an acceptable balance between computational efficiency and accuracy. The Bayesian update is structured in a recursive fashion.
 (6)
(6)
It is the hidden state of the user’s intention at the current moment; Ot is the current multimodal observation information; P(It|It-1) is the intention state transition model; and P(Ot|It) is the observation likelihood model.
At each interaction, the system receives observation information from voice input, facial expressions, behavioral history, and voice emotions. Voice input is vectorized through a pre-trained semantic coding model; facial expressions are feature-extracted using an expression recognition module based on key point detection; action history uses a bidirectional recurrent neural network to model the time-dependent structure; and voice emotion information is parameterized through rhythmic features and Mel-frequency cepstral coefficient extraction modules. The multi-source observation information is uniformly spliced and fed into a two-layer fully connected neural network to score the degree of match between the intention represented by each particle, and the output is a normalized probability value used to update the particle weight.
After the particle weight is updated, if the particle set's entropy falls below the threshold, the system triggers resampling. The system resampling algorithm is used during the resampling stage to retain high-weight particles, remove low-weight particles, and add new particles to maintain the total number unchanged. After resampling, the particle state is generated based on the high-frequency intention-transfer trajectory in the interaction history, thereby keeping the continuity and rationality of the reasoning. The state transfer trajectory is obtained by statistics of large-scale user interaction data, forming a Markov transition structure between intention states.
The intent distribution results generated during the particle inference process are combined into a continuous intent context representation vector using a weighted average. Each discrete intent state is pre-mapped to an embedding vector space, and the embedding vectors corresponding to all particles are weighted and summed according to the current particle weight to form an intent context representation. This representation serves as a supplementary dimension for user-state estimation and is jointly input to the policy network with the multimodal state observation at the current time step. The policy network structure is consistent with the previous section, except that the intent context branch is applied in the input layer, which is then merged with the backbone network for action distribution generation after being processed by an independent encoding layer. The fusion structure of user intent reasoning and policy network based on particle filtering is shown in Figure 1.
The action generation module's policy network combines the state with the intent context to produce action distributions, and the same input structure is utilized for the value function to ensure consistency throughout the robot. The particle filter updates recent observations using a dynamically adaptive sliding window (by default 10 times, or anywhere from 5 to up to around 50 times), balancing real-time performance and computational overhead. The window is automatically adjusted based on interaction frequency and intent changes, and it includes a time-based cooldown to assist in avoiding fluctuations. Intent inference and main policy training is decoupled: particle evolution and embedding are made to be optimized offline, and then updated online in real-time to improve robustness. The policy input consists of user behavior, the robot state, summaries of the historical context, and intent embeddings, and is also normalized; missing modalities are filled in some way according to rules. The number of particles is adaptively adjusted based on the effective sample size and possible latency constraints: if the effective sample size is below a threshold of βN (where β = 0.4–0.6), then new particles are added with the likely goal of moving around the action model; if the environment was constrained, then the robot will be able to update particle count by a moderate scale either around x10–x50, depending on environment and cost factor; a normal scope is between 50–200 particles (by default 128) and is used to allow for maneuvers calculated for the outcome, and the particle number is briefly expanded if an uncertain condition is associated with either the fuzzy search space or the environment (or both). The guiding policy considers the trade space between real-time performance, cost function efficiency, and accuracy of inference.
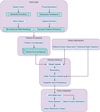 |
Fig. 1 User intention reasoning and policy network fusion structure based on particle filtering. |
3.3 Multi-time scale strategy exploration and learning mechanism
The short-term strategy adjustment uses a behavior deviation penalty structure that is updated in real time. Deviation signals are captured by multimodal sensors, including behavioral indicators such as changes in speech ( ), facial expression (
 ), and operational interruptions (
 ). After standardization, they are input into the linear transformation and gating unit to generate deviation signals:
 (7)
(7)
To normalize the deviation signal in formula (7), this paper adopts the sub-modal normalization and cross-modal unified scaling strategy. First, the mean and standard deviation of each behavioral indicator, such as voice change  , facial expression fluctuation
  , and operation interruption
  , are calculated within the sliding time window, and Z-score normalization is performed. Then, the three standardized signals are normalized to the range [−1, 1] based on the maximum absolute value and mapped to a unified scale via a learnable linear transformation Wδ and bias bδ. Finally, they are compressed into a deviation intensity score δt in the range of [0, 1] through the Sigmoid activation function to ensure that the deviations of different modalities are comparable and numerically stable before fusion.
Applying an auxiliary loss term  in the policy gradient optimization, adjust the policy output to avoid the action distribution associated with recent unsatisfactory behavior:
 (8)
(8)
 (9)
(9)
πθ is the current policy output distribution; πsafe is the distribution estimate aligned with the safe behavior space; αt is the dynamic weighting coefficient. The weight of this auxiliary item changes dynamically with the strength of the deviation signal and is used to limit behavioral deviation.
The construction of the safe policy distribution πθ is based on a set of action trajectories marked as “safe” or “no negative feedback” in historical interactions. These positive samples are obtained through supervised learning using the behavioral cloning method. First, interaction clips in which the user did not trigger interruptions, had stable emotions, and successfully progressed on the task are screened from the experience replay buffer, and their corresponding state-action pairs are extracted. Then, a lightweight neural network (a two-layer MLP) is trained, taking state st as input and outputting a probability distribution  aligned with the safe action space. This distribution serves as a conservative prior, guiding the current policy in the auxiliary loss term to avoid deviating from the verified safe behavior area.
The policy parameters are updated using an exponential sliding average, and the current parameters are merged with the historical parameters in proportion. The rate of change of the particle set confidence in the Bayesian intention update module adjusts the sliding coefficient. The update frequency decreases when the intention is stable, and the adjustment rate increases when the intention fluctuates significantly. This mechanism improves the policy's ability to respond to dynamic changes in intentions and suppresses behavioral oscillations caused by high-frequency noise.
Long-term behavior modeling is based on a nested time window trajectory structure. Each user interaction trajectory is divided into fixed-length sub-trajectories and cached hierarchically. Each layer of the cache input shares the structure of a bidirectional gated recurrent unit network to extract temporal features:
 (10)
(10)
The attention weight is:
 (11)
(11)
And the long-term behavior preference embedding elong is generated by the weighted attention mechanism:
 (12)
(12)
elong is input into the value network to form a time scale adjustment term:
 (13)
(13)
Vshort is the short-term state value function. The preference estimation result is combined with the short-term value function output through the residual structure to form the final strategy objective function, thereby enhancing the strategy's sensitivity to historical behavior.
Formula (13) introduces a residual structure to integrate the immediate feedback of short-term value Vshort(st) with the historical features of long-term preference embedding elong, achieving complementary synergy. This design injects long-term preferences while maintaining short-term stability, improving sensitivity and training stability across time scales. The long-term value estimation adaptively adjusts the reward discount based on the intent consistency index: when consistency is high, the discount is increased to strengthen stable memory; when consistency is low, the discount is decreased to prevent overfitting.
The formula for the intention consistency index is shown in equation (14).
 (14)
(14)
In formula (14), COt represents the intention consistency index, M represents the total number of particles, and  represents the normalized weight of the particle at the current time t.
Strategy exploration employs an asynchronous time-scale noise injection mechanism. The short-term strategy output layer perturbations are built based on the parameter noise, and the perturbation signals are related to behavior embedding injected at the long-term strategy input end. The perturbation amplitude is also negatively correlated with strategy stability. This structure allows for a greater variety of strategy explorations and improves generalization ability towards unknown intent structures.
The overall structure uses asynchronous training of short-term and long-term modules, with frequent short-term updates and long-term modules updated only when the strategy is stable. The two modules share the state-observation encoder and the intent embedding representation. The encoder consists of convolution and Transformer modules to extract local patterns and long-range dependency information. The fused state-intent representation is sent to the policy branch and value estimation network to generate the action distribution and state value function.
The strategy output distribution employs an entropy regulation mechanism to dynamically adjust the exploration intensity and gradually shrink the distribution range during the strategy convergence phase, thereby improving action certainty. The long-term preference output is combined with the immediate reward as a delayed signal to calculate the generalized advantage estimate and participate in the strategy gradient optimization. The training uses the proximal strategy optimization algorithm, and the clipping range is adaptively set based on the strategy history's variance to suppress behavior deviation caused by excessive strategy changes.
In the entropy regulation mechanism, the policy entropy at time t is shown in formula (15).
 (15)
(15)
In formula (15), ϱθ(a|s) represents the probability of the policy selecting an action in a state, and D represents the set of states used to estimate entropy.
The entropy regularized policy objective is shown in formula (16).
 (16)
(16)
The first term in formula (16) is the common PPO proxy objective;  represents the generalized advantage estimate; ς represents the PPO clipping parameter; and
  represents the entropy penalty coefficient.
The adaptive entropy coefficient scheduling is shown in formula (17).
 (17)
(17)
In formula (17),  represents the corresponding exponential moving average (smoothed estimate), HStarget represents the target entropy (exploration intensity expected to be retained), and χ represents the sensitivity coefficient (controls the steepness of the coefficient when changing from high entropy to low entropy). Bmax and βmin represent the upper/lower bounds of the entropy coefficient, respectively.
To ensure that the dynamic weighting coefficients respond promptly to behavioral deviation signals without introducing high-frequency oscillations, this paper employs an engineering strategy that combines noise suppression and confidence adjustment to update the coefficients. First, the raw deviation signal is smoothed over a short period (a recommended window length of five interactions, or an equivalent exponentially weighted average), with a default smoothing strength of approximately 0.2, to obtain a normalized deviation score. Next, the deviation score is gradually integrated with the intent confidence (measured by the number of valid samples in the particle filter or particle entropy). When intent confidence is low, the penalty weight is preferentially increased to favor conservative/safe actions. Conversely, when confidence is high, the weight is allowed to decrease to increase adaptability. To prevent sudden weight changes, a maximum change rate is capped at each step (no more than ±10% of the previous value), and a short cool-down period is implemented after significant increases to allow the weights to fall back smoothly. Finally, Bayesian optimization is performed on an offline validation dataset using minimum and maximum weight bounds (e.g., 0.1–2.0) and a small number of hyperparameters (smoothing window, confidence threshold, and change rate cap) to obtain a default parameter combination that improves the reproducibility of the method across different deployment resources and tasks.
3.4 Counterexample-guided automaton reward structure reasoning
The collection of strategy failure samples is based on explicit task-interruption signals and implicit stagnation states during the interaction process, combined with behavior-state sequences and sparse reward features. A gated recurrent unit is used to build a state fallback network that extracts key failure fragments. The heuristic rules for collecting and annotating counterexamples are presented in Table 1.
In Table 1, the default trigger conditions for “Invalid Sample Removal” were adjusted during offline verification. When a counterexample sample's multimodal confidence score is below 0.20 (indicating extremely low confidence in any or most of the speech, vision, or semantic modalities), or its particle/sample weight is consistently below 0.01 (approximately insignificant), or its support in the buffer is less than five independent observations (too sparse to be statistically significant), or the sample is more than 1000 interaction steps away from the current sliding window (too old), or its modality-missing ratio exceeds 50% (incomplete data). Suppose the sample's action distribution differs minimally from the average distribution in the most recent sliding window (KL divergence below 0.02). In that case, it is considered not an actual fault and can be safely removed. These thresholds are conservative in online deployments, and metadata about removed samples is recorded for subsequent review and rollback.
The change rate of the action distribution and the state transition confidence are used to determine the counterexample boundary index, and the dynamically adjusted decision threshold is based on the KL (Kullback-Leibler) divergence to eliminate invalid samples.
The failure trajectory is encoded, and the multimodal Transformer is used to extract the semantic embedding of the state, while bidirectional temporal convolution captures the action pattern characteristics. The attention mechanism is integrated to achieve clustering and to obtain subtask candidate units that contain state transition labels and failure indication information, serving as input for automaton construction.
The automaton structure is designed based on a finite state machine with counterexample constraints. The state set is composed of embedded cluster centers, and the transition edge is constructed by combining action frequency and failure weight. The concatenated features of state differences and action embeddings are used to define the transition function, which is split into valid and failure paths. The latter is used for reverse-engineering rewards. The strategy optimization applies a structural matching loss to measure path deviation and adjust strategy behavior.
State merging is based on the consistency of embedding vectors and the overlap of action confidences, and redundant transfers are removed using invalid-edge detection mechanisms. The automaton structure has path interpretability and dynamic transition probabilities, enabling it to accurately characterize the implicit reward structure driven by user preferences.
The automaton is embedded in the policy network to restrict the execution of illegal transfer paths, and the policy entropy term constrains the actions that violate the automaton's structure. The automaton state mapping enhances the value function's long-term target estimation and improves learning efficiency in sparse feedback environments.
The structure update uses a sliding window to manage failed samples and screens incremental new states based on confidence gain. The automaton structure and strategy are updated alternately. After the strategy is stable, the automaton structure is frozen for behavior guidance in the generalization stage. This method enhances the modeling capability of the reward function and the stability of the strategy, improving the adaptability and response speed of service robots to complex user behavior patterns in human-computer interaction.
This paper provides clear criteria and merging operators for merging candidate states in automata. Let the two states to be merged be embedded as si and sj; their respective sample support numbers be ni and nj; the corresponding outbound transition distributions be  ; and the corresponding action confidence sets be Ai and Aj. The merge is performed if and only if the following three conditions are met simultaneously: (1) the embedding similarity is high, that is, the distance metric d(si,sj) (cosine distance is used) is less than the threshold ε; (2) the transition distributions are similar, using the total variation distance, with the requirement TV(Pi, Pj) < p; (3) the action confidence overlap is high, defined as
  and the support number ni + nj after merging is not less than the minimum support suppotmin. The merged state embedding takes the support-weighted center
  ; the merged transition distribution is weighted by the support
  ; the action confidence sets are taken as the union, and their confidence scores are updated with weights. To ensure stability, the merge operation is performed in batches within the sliding window or structure update cycle, and the merge history is recorded for rollback and interpretability checking. The thresholds ε, ρ, η, and supportmin are determined by Bayesian optimization on the offline validation set and are conservatively set in the online deployment to prevent over-merging.
Heuristic rules for counterexample sample collection and annotation.
3.5 Joint strategy optimization and convergence guarantee mechanism
The policy model and reward model are updated alternately within a dual optimization framework. The policy network adjusts its parameters using gradient ascent based on the current reward signal to improve adaptability, while the reward model reconstructs the latent reward function using behavioral data. Both are synchronized using a time-slicing mechanism to ensure information consistency and parameter stability. The joint optimization architecture is shown in Figure 2.
A soft update mechanism is adopted, updating only a portion of the policy network weights each time to smoothly synchronize the target and the online network, reducing volatility and improving training stability. The reward model is constrained by the automaton state transition rules to ensure logical consistency and interpretability. To ensure policy safety, an action space constraint module is designed to filter unsafe outputs based on historical safe behaviors and a rule base, and a safety loss term is introduced to penalize out-of-bounds behavior, promoting robust policy convergence.
Convergence in the joint optimization process is achieved through the monitoring of multiple indicators. The strategy performance change curve and the reward model’s loss function are tracked simultaneously, and an early stopping mechanism prevents overfitting. Smooth strategy evaluation indicators are used to reduce the interference of noise on convergence judgment. In addition, a strategy diversity maintenance mechanism is applied to prevent the strategy from falling into local optimality, and the adaptability to unknown user behavior patterns is maintained by dynamically adjusting the exploration rate. The overall framework combines gradient-based optimization with structured model constraints to ensure the synchronous evolution of the strategy and reward model.
To ensure stability and reproducibility during alternating updates of the policy network and reward model, this paper adopts a time-sliced alternating update strategy. The policy network is updated frequently in short cycles to maintain immediate adaptation to the environment. Rolling sampling is used to perform proximal policy optimization in several small batches. By default, each rolling sampling cycle collects approximately 512 time steps of data. After conducting several rounds (4 rounds) of PPO-style updates in small batches (64 samples), the new parameters are soft-updated to the target network and submitted to performance monitoring metrics. The reward model (including the parameterized portion of the counterexample automaton) is updated over longer cycles based on aggregated data to avoid misleading adjustments caused by short-term noise. By default, offline retraining of the reward model is triggered after 50 short-cycle policy network updates. Each reward model update uses batched historical trajectories as input and is validated after the update. If the validation loss does not improve, early stopping is used, and the model is rolled back to the previous stable version. Additionally, structural components (such as the automaton's topology/merging operations) undergo less frequent structural updates (every 50 policy iterations) and implement a short freeze period after structural changes to give the policy time to adapt to the new reward signal.
To avoid the strategy taking a homogeneous pattern or relying too heavily on high-frequency actions, we introduce a mechanism for maintaining strategy diversity. This mechanism tracks action distribution and iterative variability. If the distribution becomes overly concentrated, the mechanism will expand the exploration range through slight perturbation and resampling. The mechanism also builds a memory pool using past interactions to reinforce low-frequency, high-value actions. This mechanism maintains exploratory activity while ensuring convergence and is intended to enhance the generalizability and robustness of the strategy.
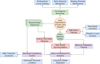 |
Fig. 2 Joint strategy and reward model optimization architecture. |
4 Experimental design
The experimental setup consisted of a mid-range desktop machine (Intel i7-12700F, 16 GB RAM, no dedicated GPU, running Ubuntu 22.04). The simulation environment was CoppeliaSim EDU and Python 3.10 was used for the main program language. The model training was conducted using PyTorch 2.0.1 on a CPU. The robot performed motion, visual, and audio tasks - each process utilized a USB rocket, MediaPipe, and librosa respectively. The robot was meant for navigation and voice interactions, and its actions were run via an API. The experimental conditions represented a simulated Home Assistant task to validate the overall interactive performance of the system on limited hardware. User behavior data was collected from the TASTE-Rob, DROID, and RLDS Ecosystem datasets, and was merged into intermediate behavior vectors for input to the model, following sliding window alignment and interpolation repair. For behavior simulation, HMM and GANs were used to produce high-dimensional trajectories to represent changes in intent. Performance feedback was collected during interaction as explicitly and indirectly, and then formed into sequences of the sparse reward trajectory with outliers filtered based off of an experience buffer.
The experimental procedure includes simulation startup, model initialization, loading of behavior sequences, simulated interaction, recording rewards, and updating the model. Policy training is based on the policy gradient method, belief updates are performed every 5 rounds of interaction, and the automaton reward structure is adjusted every 50 rounds. The behavior encoding dimension is 128, and the hidden states follow a Gaussian distribution. The policy and belief networks are trained independently with learning rates of 1e-4 and 0.01, respectively. The states are normalized by z-scores, the action space is [−1,1], and the sampling step size is 0.2. The convergence criteria are: policy reward fluctuation <0.5%, stability ≥20 rounds, and no new nodes added to the automaton within 100 steps. Abnormal actions are pruned for safety constraints, and the error detection threshold is 0.9. During the deployment phase, frame rate, latency, and error are recorded, and the results are analyzed offline and used for model retraining.
The paper’s method is compared with MDARQN (Multimodal Deep Attention Recurrent Q-Network), LLM-DRL (large language model-deep reinforcement learning), and CRI (Crowd-Robot Interaction).
To ensure the consistency and repeatability of the long-term preference embedding with the dimensions of other modules in this paper, this paper uses a single-layer bidirectional GRU in all long-term layers, with a hidden layer size of 64 units in each direction (a 128-dimensional temporal representation is obtained after bidirectional splicing, which is consistent with the 128-dimensional behavior encoding dimension in the experiment); in resource-constrained real-time deployments, the number of hidden layers in each direction is reduced to 32 to minimize latency (64 dimensions after splicing), and in offline training or high-performance deployments with sufficient computing power, each direction can be expanded to 128 to improve representation capabilities (256 dimensions after splicing); at the same time, a small dropout (about 0.1–0.3) is used.
5 Service robot interaction strategy performance and user behavior insights
5.1 Response efficiency to changes in user intentions
In human-computer interaction, the efficiency of the system's response to changes in user intentions and the stability of its policy output are key indicators of its actual usability and intelligence level. To systematically evaluate the responsiveness of this method under multiple types of interaction conditions, the experiment compared and analyzed the delay performance of different policy models in responding to changes in user intentions from three dimensions, including intention category, interaction scenario, and feedback form, to explore the sensitivity and adaptability of the model to different types of changes. The results of the analysis of changes in user intention and the stability of policy output are shown in Figures 3 and 4.
Figure 3 shows the average response delay for each method across three dimensions: intent category, interaction scenario, and feedback type. The horizontal axis is the specific category, and the vertical axis is the response time delay. In the intent category subgraph, the response time delay of the proposed method under navigation instruction changes, information request changes, and action behavior changes is 1.38 s, 1.56 s, and 1.17 s, respectively, which are better than those of other methods, especially in action behavior changes. In the interactive scene subgraph, the delays of this method across the indoor navigation, object operation, and question-answering interaction scenes are 1.49, 1.52, and 1.42 s, respectively, which are also lower than those of other methods, indicating that this strategy is more adaptable to scene switching. The feedback type sub-graph shows that in the two human-computer feedback modes of explicit feedback and implicit feedback, the response time delay of this method is 1.41 s and 1.36 s, which is still the shortest, and the leading advantage is more evident under the implicit feedback condition, highlighting its perception ability of weak supervision signals.
Figure 4 illustrates the policy output score changes of the four methods in continuous interaction. The horizontal axis represents time, and the vertical axis represents the policy score, reflecting the decision confidence. Ideally, the output should be stable, with small fluctuations representing high consistency and robustness. The curve of the method presented in this paper is the most stable, with a standard deviation σ = 0.031, significantly lower than LLM-DRL (0.126), MDARQN (0.074), and CRI (0.05).
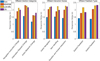 |
Fig. 3 Comparison of response delays in different dimensions. |
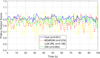 |
Fig. 4 Strategy output stability comparison. |
5.2 Task completion statistics in sparse reward environment
In order to test the resilience of the strategy with limited feedback, a combined scenario was developed consisting of three task types (navigation, delivery, and question answering) and three levels of sparsity (light, moderate, and heavy) to create a test of multi-turn interactions with missing information. The stability and adaptability of each method were demonstrated using task completion rates for each participant, which can be viewed in Figure 5.
In general, the suggested method has a high completion rate with minimal variation across all reported test conditions: 87.27%–90.08% in mildly sparse navigation tasks, 84% on average in moderately sparse tasks, and 78.14% in heavily sparse tasks. Its benefit stems from a combination of contextual dynamic Modeling and optimization of policy stability, which allows accurate estimation and capability of robust decision making with missing information. In contrast, LLM-DRL relies on complete context, demonstrating a sharp decline in performance when feedback is absent. CRI has a historical memory mechanism for feedback, yet shows considerable fluctuation in highly semantically dependent scenarios (e.g., heavily sparse question-answering tasks).
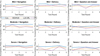 |
Fig. 5 Comparison of multiple rounds of interactions under different sparse reward environments. |
5.3 Quantitative evaluation of user satisfaction and experience
To assess the user experience of various behavior recognition methods, a subjective evaluation experiment was carried out. Thirty users aged 18–50 from different backgrounds participated and performed a pre-defined interaction task that was rated across five dimensions using a 5-point Likert scale: usability, response time, accuracy of comprehension, comfort level, and overall satisfaction. The results are presented in Table 2.
The suggested approach outperforms MDARQN, LLM-DRL, and CRI on all dimensions (usability 4.35, response speed 4.20, understanding accuracy 4.30, comfort 4.10, overall satisfaction 4.25), particularly in response speed and understanding accuracy. This is likely due to deep modeling of user behavior and responsiveness in real-time to optimize responses, allowing for rapid intent recognition and enhanced fluency in interactions. Other methods lag in performance because of limitations in feature extraction and policy learning.
Quantitative evaluation results of user satisfaction and interactive experience indicators.
5.4 User behavior pattern recognition accuracy and error analysis
To verify the method's ability to distinguish between different types of user behavior, a balanced sample set containing 50 instances of each of the five categories was constructed. Typical service-oriented interaction scenarios were classified and predicted, and a normalized confusion matrix was generated to show the recognition accuracy and misjudgment of each category. The results are shown in Figure 6.
The classification performance of the four methods in the five user behavior categories is displayed in Figure 6. Our proposed method achieves an accuracy of 0.90 in the “Request Help” category, demonstrating the highest overall recognition rate in this context with low interference and excellent stability. MDARQN and LLM-DRL exhibit substantial drops in distinguishing between “idle” and “urgent” behaviors (i.e., in case of LLM-DRL, only 0.66 is achieved). Our benefit to these results originates from the multimodal fusion of context and modeling of dynamics priors, while literature-based studies are based on pre-configured templates inducing confusion between similar behaviors. As a result, our method demonstrates the highest overall recognition correct rate and robustness when compared to the others.
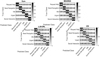 |
Fig. 6 User behavior recognition confusion matrix. |
5.5 Detection and response efficiency of changes in user behavior patterns
Experiments simulated 30 typical scenarios, recording the model's recognition latency and response accuracy after changes to comprehensively measure perception response performance. The results are shown in Figure 7.
In summary, the suggested approach has a latency that ranges between 1.325 s and 1.927 s with an accuracy extend from 85.03% to 92.24%, which shows a compact distribution and hence indicates low latency, strong robustness, and high accuracy. The approach that performed the worst was CRI, which had an average latency of 2.237 s, and an accuracy of 83.9%, which indicated a larger distribution, and showed slow response and large variance. Performance differences between approaches mainly arise from the mechanisms related to state awareness and policy generation, as the proposed approach uses dynamic modeling of change signals in behavior and a time-sensitive gating structure to offer fast switching policies and low latency; however, both LLM-DRL and CRI use static priors and cannot handle non-stationary changes in behavior. Finally, while MDARQN outperforms LLM-DRL and CRI, it is still significantly impacted by the delays in change detection and lack of stability.
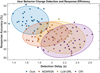 |
Fig. 7 Latency-accuracy distribution in the task of detecting and responding to changes in user behavior patterns. |
5.6 Long-term stability test
The experiment simulated multiple samplings over 15 consecutive days to reflect the performance fluctuations and stability differences of each algorithm during long-term operation.
Figure 8 shows the distribution of response latency, memory usage, and accuracy fluctuations for the four methods in long-term stability tests. Our proposed method has a median latency of approximately 1.44 s, lower than LLM-DRL's 2 s; its accuracy fluctuation standard deviation is 1.4%, which is better than CRI's 2.55%, demonstrating the most stable performance. These differences mainly stem from the advantages of structural optimization and parallel computing, enabling our proposed method to achieve better practical performance, superior resource utilization, and stability than other methods.
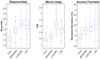 |
Fig. 8 Comparison of long-term stability test results. |
6 Conclusion
This paper outlines a novel reinforcement learning-based approach for optimizing interaction policies to overcome the adaptive challenges of service robots in dealing with complex user behaviors, dynamic user intentions, and sparse rewards. Our method allows for continuous mining of user behavior patterns and guides policy optimization through a hybrid approach of dynamic belief updates and counterexample-driven automata learning. Evaluation results demonstrate that the system adapts well to intent variations and achieves low-latency responses (policy output standard deviation of 0.031) across various service scenarios. Overall, the system achieves a 78.14% task completion rate and a 4.25 user satisfaction score under sparse reward conditions, confirming its advantages in policy generalization, safety, and behavioral modeling capabilities.
Acknowledgments
Thanks to all the authors for their contributions to the article.
Funding
No funding were used to support this study.
Conflicts of interest
The authors have nothing to disclose.
Data availability statement
The data that support the findings of this study are available from the corresponding author upon reasonable request.
Author contribution statement
Conceptualization, M.G. and Z.F.; Methodology, M.G. and Z.F.; Data Curation, M.G.; Writing – Original Draft Preparation, M.G.; Writing – Review & Editing, Z.F.
References
- P. Asgharian, A.M. Panchea, F. Ferland, A review on the use of mobile service robots in elderly care, J. Robotics, 11, 127–154 (2022) [Google Scholar]
- L. Guo, L. Gong, Z. Xu, W. Wang, M.H. Chen, The role of service robots in enhancing customer satisfaction in embarrassing contexts, J. Hosp. Tour. Manag. 59, 116–126 (2024) [Google Scholar]
- X. Zhu, B. Zhang, Y. Qiu, S.A. Chepinskiy, An interaction behavior decision-making model of service robots for the disabled based on human–robot empathy, IEEE Access, 12, 15778–15790 (2024) [Google Scholar]
- O. Nocentini, J. Kim, Z.M. Bashir, F. Cavallo, Learning-based control approaches for service robots on cloth manipulation and dressing assistance: a comprehensive review, J. NeuroEng. Rehabil. 19, 117–142 (2022) [Google Scholar]
- W. Jebrane, N. ElAkchioui, Advancing distributed distributional deterministic policy gradients for autonomous robotic control across diverse environments, J. Control, Autom. Electr. Syst. 5, 1059–1077 (2024) [Google Scholar]
- X. Gao, L. Yan, Z. Li, G. Wang, I.M. Chen, Improved deep deterministic policy gradient for dynamic obstacle avoidance of mobile robot, IEEE Trans. Syst. Man Cybern.: Syst. 53, 3675–3682 (2023) [Google Scholar]
- Z. Chen, Y. Nakamura, H. Ishiguro, Android as a receptionist in a shopping mall using inverse reinforcement learning, IEEE Robot. Autom. Lett. 7, 7091–7098 (2022) [Google Scholar]
- G. Abbate, A. Giusti, V. Schmuck, O. Celiktutan, A. Paolillo, Self-supervised prediction of the intention to interact with a service robot, Robot. Auton. Syst. 171, 104568–104577 (2024) [Google Scholar]
- A. Khan, J.P. Li, M.K. Hasan, N. Varish, Z. Mansor, S. Islam, R.A. Saeed, M. Alshammari, H. Alhumyani, PackerRobo: Model-based robot vision self supervised learning in CART, Alex. Eng. J. 61, 12549–12566 (2022) [Google Scholar]
- E. Kipnis, F. McLeay, A. Grimes, S. De Saille, S. Potter, Service robots in long-term care: a consumer-centric view, J. Serv. Res. 25, 667–685 (2022) [Google Scholar]
- S. Ozturkcan, E. Merdin-Uygur, Humanoid service robots: the future of healthcare?, J. Inf. Technol. Teach. Cases, 12, 163–169 (2022) [Google Scholar]
- O. Demir, A. Vatan, Robotisation in travel and tourism: tourist guides' perspectives on robot guides, Tour. Manag. Stud. 20, 13–23 (2024) [Google Scholar]
- S. Rosa, M. Randazzo, E. Landini, S. Bernagozzi, G. Sacco, M. Piccinino, L. Natale, Tour guide robot: a 5G-enabled robot museum guide, Front. Robot. AI, 10, 1323675–1323683 (2024) [Google Scholar]
- H. Abdollahi, M.H. Mahoor, R. Zandie, J. Siewierski, S.H. Qualls, Artificial emotional intelligence in socially assistive robots for older adults: a pilot study, IEEE Trans. Affect. Comput. 14, 2020–2032 (2022) [Google Scholar]
- J.D. Huang, I.A. Wong, Q.L. Lian, H. Huang, Robotic companionship for solo diners: the role of robotic service type, need to belong and restaurant type, Int. J. Contemp. Hosp. Manag. 37, 890–917 (2025) [Google Scholar]
- Y. Cui, Y. Zhang, C.H. Zhang, S.X. Yang, Task cognition and planning for service robots, Intell. Robot. 5, 119–142 (2025) [Google Scholar]
- M. Jorda, M. Vulliez, O. Khatib, Local autonomy-based haptic-robot interaction with dual-proxy model, IEEE Trans. Robot. 38, 2943–2961 (2022) [Google Scholar]
- A. Hernandez, R.M. Ortega-Mendoza, E. Villatoro-Tello, C.J. Camacho-Bello, O. Perez-Cortes, Natural language understanding for navigation of service robots in low-resource domains and languages: scenarios in spanish and nahuatl, Mathematics, 12, 1136–1158 (2024) [Google Scholar]
- R. Filieri, Z. Lin, Y. Li, X. Lu, X. Yang, Customer emotions in service robot encounters: a hybrid machine-human intelligence approach, J. Serv. Res. 25, 614–629 (2022) [Google Scholar]
- S. Duan, Q. Shi, J. Wu, Multimodal sensors and ML‐based data fusion for advanced robots, Adv. Intell. Syst. 4, 2200213–2200222 (2022) [Google Scholar]
- T. Gong, D. Chen, G. Wang, W. Zhang, J. Zhang, Z. Ouyang, F. Zhan, R. Sun, J.C. Ji, W. Chen, Multimodal fusion and human-robot interaction control of an intelligent robot, Front. Bioeng. Biotechnol. 11, 1310247–1310257 (2024) [Google Scholar]
- K.J. Wang, C.J. Lin, A.A. Tadesse, B.H. Woldegiorgis, Modeling of human–robot collaboration for flexible assembly–A hidden semi-Markov-based simulation approach, Int. J. Adv. Manuf. Technol. 126, 5371–5389 (2023) [Google Scholar]
- G. Braglia, M. Tagliavini, F. Pini, L. Biagiotti, Online motion planning for safe human–robot cooperation using b-splines and hidden markov models, Robotics, 12, 118–143 (2023) [Google Scholar]
- P. Bachiller, D. Rodriguez-Criado, R.R. Jorvekar, P. Bustos, D.R. Faria, L.J. Manso, A graph neural network to model disruption in human-aware robot navigation, Multimed. Tools Appl. 81, 3277–3295 (2022) [Google Scholar]
- Y. Yang, R. Yang, Y. Li, K. Cui, Z. Yang, Y. Wang, J. Xu, H. Xie, Rosgas: adaptive social bot detection with reinforced self-supervised gnn architecture search, ACM Trans. Web, 17, 1–31 (2023) [Google Scholar]
- H. Lv, H. Yan, K. Liu, Z. Zhou, J. Jing, Yolov5-ac: attention mechanism-based lightweight yolov5 for track pedestrian detection, Sensors, 22, 5903–5928 (2022) [Google Scholar]
- B. Nikpour, D. Sinodinos, N. Armanfard, Deep reinforcement learning in human activity recognition: a survey and outlook, IEEE Trans. Neural Netw. Learn. Syst. 36, 4267–4278 (2024) [Google Scholar]
- Z. Lv, F. Poiesi, Q. Dong, J. Lloret, H. Song, Deep learning for intelligent human–computer interaction, Appl. Sci. 12, 11457–11485 (2022) [Google Scholar]
- B. Singh, R. Kumar, V.P. Singh, Reinforcement learning in robotic applications: a comprehensive survey, Artif. Intell. Rev. 55, 945–990 (2022) [Google Scholar]
- F. Munguia-Galeano, S. Veeramani, J.D. Hernandez, Q. Wen, Z. Ji, Affordance-based human–robot interaction with reinforcement learning, IEEE Access, 11, 31282–31292 (2023) [Google Scholar]
- S. Adams, T. Cody, P.A. Beling, A survey of inverse reinforcement learning, Artif. Intell. Rev. 55, 4307–4346 (2022) [Google Scholar]
- R. Devidze, P. Kamalaruban, A. Singla, Exploration-guided reward shaping for reinforcement learning under sparse rewards, Adv. Neural Inf. Process. Syst. 35, 5829–5842 (2022) [Google Scholar]
Cite this article as: M. Guo, Z. Feng, Mining User Behavior Patterns Based on Reinforcement Learning Algorithm to Optimize Service Robot Interaction Strategy, Mechanics & Industry 27, 9 (2026), https://doi.org/10.1051/meca/2026002
All Tables
Quantitative evaluation results of user satisfaction and interactive experience indicators.
All Figures
|
Fig. 1 User intention reasoning and policy network fusion structure based on particle filtering. |
| In the text | |
|
Fig. 2 Joint strategy and reward model optimization architecture. |
| In the text | |
|
Fig. 3 Comparison of response delays in different dimensions. |
| In the text | |
|
Fig. 4 Strategy output stability comparison. |
| In the text | |
|
Fig. 5 Comparison of multiple rounds of interactions under different sparse reward environments. |
| In the text | |
|
Fig. 6 User behavior recognition confusion matrix. |
| In the text | |
|
Fig. 7 Latency-accuracy distribution in the task of detecting and responding to changes in user behavior patterns. |
| In the text | |
|
Fig. 8 Comparison of long-term stability test results. |
| In the text | |
Current usage metrics show cumulative count of Article Views (full-text article views including HTML views, PDF and ePub downloads, according to the available data) and Abstracts Views on Vision4Press platform.
Data correspond to usage on the plateform after 2015. The current usage metrics is available 48-96 hours after online publication and is updated daily on week days.
Initial download of the metrics may take a while.