| Issue |
Mechanics & Industry
Volume 20, Number 6, 2019
|
|
|---|---|---|
| Article Number | 611 | |
| Number of page(s) | 10 | |
| DOI | https://doi.org/10.1051/meca/2019046 | |
| Published online | 26 November 2019 | |
Regular Article
Research on the relationship between transmission efficiency and input torque of manual transmission
School of Automotive Engineering, Wuhan University of Technology, Wuhan, PR China
* e-mail: This email address is being protected from spambots. You need JavaScript enabled to view it.
Received:
2
March
2018
Accepted:
12
November
2018
Abstract
Based on the manual transmission of a micro car, this paper would present the analysis of the factors affecting the transmission efficiency (TE) and the calculation formula of TE. Accordingly, the calculation model of Matlab/Simulink TE would be built to figure out how TE varies with input torque. Meanwhile, a set of manual transmission test bench would be designed and used to verify the theoretical simulation results. It adopts a common DC bus energy feedback closed system which can feedback the power generated by the load motor to the grid through the DC bus so as to save the electricity and produce less pollution. Therefore, while the test bench can reflect the variation trend of TE about the manual transmission truly, it is comparatively reliable. Apart from being energy-saving, its unique versatility could definitely predict its exceptional potential. The data of TE obtained from the test bench are compared with the simulation result. It showed that the TE of bench test and simulation result are similar, though companied by less than 2% error difference which is within the allowable range. Most importantly, the bench test results proved the validity of the theoretical analysis statistically, which is of great necessity and significance to the research of TE.
Key words: Transmission efficiency / input torque / DC bus / test bench
© AFM, EDP Sciences 2019
1 Introduction
The increasing of TE can reduce the fuel consumption of automobile directly so as to improve its dynamic performance. Moreover, the higher the TE is, the less power loses. As such, the internal oil temperature of the transmission lubricating oil could be reduced, thereby further extending the life of the transmission parts. Therefore, it is of great significance to explore how to improve the TE of manual transmission.
Kolivand proposes a new TE model of spiral bevel and hypoid gear, the model combines a computationally efficient contact surface model and a mixed traction model by elastic hydrodynamic lubrication (EHL) to predict power losses of transmission. The effect of the surface contact pressure, contact radius, oil temperature and surface roughness on the loss of gear friction power was researched in this paper [1]. Xu proposes a prediction method of the general gear pair meshing mechanical efficiency which combines the gear contact analysis model with the coefficient of friction model to predict gear mechanical efficiency in a typical operation condition [2].
Jun of Changan University deduces the calculation formula of meshing efficiency of involute gear from the theoretical mechanics. This paper would use the average equivalent friction coefficient which is applicable to the engineering practice to simplify the calculation and use MathCAD engineering calculation software for the calculation of TE [3].
Xi et al. of Shanghai University study the rolling bearing, the sliding-rolling ratio (SRR), load, speed and other operating parameters of the rolling bearing are researched. Then the power loss calculation model of wearing rate under the operation condition of sliding-rolling was established [4]. Xie and Rao of Shanghai JiaoTong University researched the nature of friction coefficient of lubricated bearing, calculated the Stribeck curves as the function of load and speed, and put forward the essential model of friction coefficient [5].
Lizhi of Jilin University studied a transmission test-bench of electric driven closed system for performance test analysis and research of a heavy commercial vehicle transmission. It has high precision, simple structure, low cost and high automation. This paper would study the DC bus technology, analyze the design principle of the DC bus system, and complete the design and development of the DC bus system. The test bench is able to meet basic testing requirements of transmission [6].
2 Theory analysis of TE
In this paper, a type of SC12M5B manual transmission for a micro car is studied. The transmission has five forward gears and one reverse gear, with the maximum transmission torque of 108 N · m and the ratio of transmission: 1th ratio is 3.857, 2th ratio is 2.176, 3th ratio is 1.419, 4th ratio is 1, 5th ratio is 0.808, reverse gear ratio is 4.128. Figure 1 is an internal structure diagram of the SC12M5B transmission.
The difference between input and output power is power loss when transmission is operating which will be converted into other energy loss. The power loss is directly related to the value of TE. It mainly include gears meshing power loss P
m
(kW), bearings friction power loss P
b
(kW), churning oil power loss P
c
(kW) and the gearbox seal power loss P
y
(kW) [7,8]. Therefore, the TE of transmission is the ratio of the difference value between total input power and total loss power. The formula is: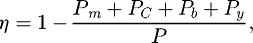 (1)
P is the total input power of the transmission.
(1)
P is the total input power of the transmission.
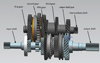 |
Fig. 1 Internal structure diagram of transmission. |
2.1 Gears meshing power loss
According to the characteristics of gear meshing, meshing power loss is caused by sliding and rolling friction in gear meshing so that the gear meshing power loss can be divided into sliding friction power loss P
s
(kW) and rolling friction power loss P
r
(kW) (2)
(2)
The meshing process of a involute gear as shown in Figure 2.
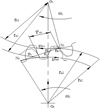 |
Fig. 2 Meshing process of an involute gear. |
2.1.1 Calculation of sliding friction power loss P s
The sliding friction power loss is mainly caused by the sliding of meshing point between the driving gear and the driven gear, and the calculation is represented as follow: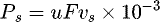 (3)where u is the coefficient of instantaneous sliding friction; F is the normal load of tooth surface (N); vs
is the instantaneous sliding speed on meshing point (m/s). F and vs
are expressed by:
(3)where u is the coefficient of instantaneous sliding friction; F is the normal load of tooth surface (N); vs
is the instantaneous sliding speed on meshing point (m/s). F and vs
are expressed by: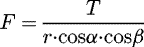 (4)
(4)
 (5)where T is the input torque of driving gear (N m), r is the pitch radius of driving gear (m), α is the pressure angle of gear, β is the helix angle of gear, n is the rotational speed of driving gear (rpm), z
1 and z
2 are the respectively tooth number of driving and driven gears, s is the distance from meshing point to meshing node (mm).
(5)where T is the input torque of driving gear (N m), r is the pitch radius of driving gear (m), α is the pressure angle of gear, β is the helix angle of gear, n is the rotational speed of driving gear (rpm), z
1 and z
2 are the respectively tooth number of driving and driven gears, s is the distance from meshing point to meshing node (mm).
The instantaneous sliding friction power loss in gear meshing (P
si
) is then expressed by: (6)
(6)
In order to make the calculation result more accurate, first integrate the P
si
, then average the value, finally the average value is used to represent the sliding friction power loss: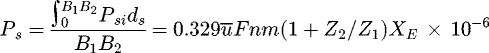 (7)
where B
1
B
2 is the length of the actual meshing line (mm),
(7)
where B
1
B
2 is the length of the actual meshing line (mm),  is the average coefficient of sliding friction, m is the module of gears (mm), X
E
is the impact factor of overlap.
is the average coefficient of sliding friction, m is the module of gears (mm), X
E
is the impact factor of overlap.
The calculation formula of the average coefficient of sliding friction is proposed by Benedict and Kelley [9]. This expression is given by: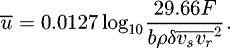 (8)
(8)
In which, b is the effective tooth width (mm), ρ is the density of lubricating oil (kg/m3), δ is the kinematic viscosity of lubricating oil (mm2/s),  is the average sliding velocity (m/s),
  is the average rolling speed (m/s).
2.1.2 Calculation of rolling friction power loss (P r )
The main reason causing rolling friction power loss is that the film pressure of lubricating oil is in irregular state and uneven. According to the knowledge of elastohydrodynamic lubrication, when the gear load is light, it is the main part of the system loss. Rolling friction power loss is mainly affected by the kinematic viscosity.
Rolling friction power loss calculation formula is studied by Hamrock et al. [2,9]. It can be obtained by: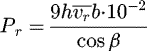 (9)where h is the thickness of elastic oil film (mm), which in turn is given by:
 (10)
where ζ is the pressure-viscosity coefficient (1/MPa), R is radius of the integrated contour curvature (mm), E is the elastic modulus (MPa), ψ is the coefficient of load (N/mm).
(10)
where ζ is the pressure-viscosity coefficient (1/MPa), R is radius of the integrated contour curvature (mm), E is the elastic modulus (MPa), ψ is the coefficient of load (N/mm).
2.2 Churning power loss
The splash lubrication is adopted in test transmission. When the gear of transmission rotates, the lubricating oil is brought to the tooth surface and is also thrown to the inner wall of the box that cause the churning power loss. Churning power loss is divided into two parts, one is caused by the friction between lubricating oil and gear, the other part is caused by suctioning and discharging of the lubricating oil in the meshing process of gears. The churning power loss is expressed by: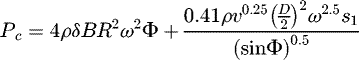 (11)where B is the width of the tooth surface (m), R is the radius of addendum circle (m), ω is the angular velocity of the gear (rad/s), Φ is the immersion angle of gear in lubricating oil (°), S
1 is the area of addendum circle (m2), D is the pitch circle diameter of gears (m).
(11)where B is the width of the tooth surface (m), R is the radius of addendum circle (m), ω is the angular velocity of the gear (rad/s), Φ is the immersion angle of gear in lubricating oil (°), S
1 is the area of addendum circle (m2), D is the pitch circle diameter of gears (m).
2.3 Bearing power loss
The bearings of manual transmission for the test bench are the deep groove ball bearing. Bearing power loss of the transmission is caused by frictional resistance between the bearing roller and other contact surface when the bearing is moving. The product of the bearings friction torque and inner ring speed is the bearings friction power loss [10]. Hence, the bearing power loss (Pb
) can be obtained by: (12)where M is the total friction torque of bearings (N · m), n is the rolling speed of bearing (rpm).
According to the empirical formula proposed by Palmgren, the total friction torque can be divided into the torque caused by the external load and the torque caused by the friction of the lubricant. The bearing power loss can be calculated by follows: (13)where f
1 is empirical coefficient related to the structure and load of bearing, F
1 is the equivalent load of the bearing (N), d
m
is the average diameter of the bearing (mm), f
0 is empirical coefficient related to bearing structure and lubricating method.
(13)where f
1 is empirical coefficient related to the structure and load of bearing, F
1 is the equivalent load of the bearing (N), d
m
is the average diameter of the bearing (mm), f
0 is empirical coefficient related to bearing structure and lubricating method.
2.4 Oil sealing power loss
Oil sealing power loss is mainly derived from the friction loss between shaft and seals [10]. It is relevant to the radius of seals and the speed of shaft. Oil sealing power loss can be calculated as follows. (14)where d
i
is the radius of seals (m), n is the rotational speed of shaft (rpm).
(14)where d
i
is the radius of seals (m), n is the rotational speed of shaft (rpm).
3 Establishment and analysis of TE estimation model
Based on the analysis above, the TE calculation model of manual transmission is established, as shown in Figure 3.
Through the simulation analysis, the total loss power of the transmission and the change of TE can be obtained. The TE of this type of manual transmission is greatly affected by the input speed, torque and lubricating oil temperature. Transmission in five gears, setting the input speed of 1000 rpm, 2250 rpm and 3500 rpm, 4750 rpm and 6000 rpm, lubricating oil temperature of 40 °C, 60 °C, 80 °C, 100 °C, the TE changes with the input torque as shown in Figure 4.
When the transmission gear, lubricating oil temperature and input speed keep unchanged, the TE is positively related to the input torque. With the increase of the input torque of the transmission, the TE increased gradually. It is concluded from the data in Figure 3 that the input torque has great influence on the TE when the gear keep unchanged and the TE of 108 N m input torque is higher 2–3% than that of 54 N m.
As for the transmission with five gear, the input speed of 3500 rpm, lubricating oil temperature of 80 °C, how the total power loss and the total input power change with the input torque is shown in Figure 5. Under the certain conditions with other factors, the total power loss and the total input power are increased with the input torque. However, the total power loss increases slowly and the ratio of the power loss to the total input power is falling instead, which can be concluded that when the input torque increased, the ratio is reduced, then the TE is increased.
According to the test standard of the micro auto transmission efficiency: QC/T568.1-2011. Selecting transmission is in three, four, five gears, transmission oil temperature is at 80 °C, the TE of the engine maximum torque (the test gearbox corresponding torque of 108 N m) and max torque point corresponding speed (the corresponding rotating speed of 3500 rpm) is tested, the average value of TE which is tested in three, four and five gear is comprehensive TE. If the parameters estimated model is modified where the SC12M5B transmission keep the input speed of 3500 rpm, lube oil temperature is 80 °C, the input torque of 108 N m, the TE of three gears is 96.6%, the TE of four gears is 97.3%, the TE of five gears is 96.9%. Hence, the comprehensive TE is 96.9%, and it is on the high side due to the neglect of other power losses in the calculation model.
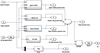 |
Fig. 3 TE calculation model. |
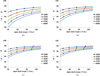 |
Fig. 4 TE changes with the input torque. (a) TE of 40 °C; (b) TE of 60 °C; (c) TE of 80 °C; (d) TE of 100 °C. |
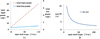 |
Fig. 5 Ratio of total power loss to the total power. (a) Total loss power and total power change. (b) Loss power and total power ratio. |
4 The establishment of test bench
The transmission test bench has long development process, from the open bench early to current closed bench. The closed bench is divided into mechanical closed, hydraulic closed and electric closed bench, electric closed bench is divided into DC and AC closed bench. As the DC electric closed test bench is energy recycling and has simple structure, it has been widely used [11]. So this paper uses the DC electric closed test bench.
4.1 The principle of bench
The TE is the ratio of the output shaft power P
1 to the input shaft power P
2, the formula is as follows: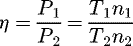 (15)
T
1 and T
2 are the transmission output torque and input torque, N m; n
1 and n
2 are the output speed of the transmission and the input speed (rpm).
(15)
T
1 and T
2 are the transmission output torque and input torque, N m; n
1 and n
2 are the output speed of the transmission and the input speed (rpm).
Therefore, it is necessary to measure the input speed, torque, output speed, torque and other parameters of the transmission for detecting the TE of the manual transmission through the test bench. According to the requirements of the transmission test standard, the TE is tested with different lubricating oil temperature as the transmission oil temperature influence the test result of TE greatly. So test bench adds lubricating oil temperature sensor to measure the oil temperature of transmission.
4.2 The composition of test bench
The test bench consists of drive and load motor, data acquisition sensor, test transmission, cooling device, reducer box, base and electrical system. The concrete object is shown in Figure 6.
 |
Fig. 6 Test bench. |
4.2.1 Drive and load motors
The selection of driving motor (DM) and load motor (LM) is based on the B12 engine and the SC12M5B transmission of a mini car. According to the parameters of the B12 engine, while the maximum output power is 60 kW and the maximum output torque is 108 N m(3500–4200 rpm), the engine speed range is 800–6000 rpm. The SIEMENS 1PH8 series motors are selected finally. Because when the motor has the maximum speed of more than 7425 rpm (maximum output speed of the transmission in fifth gear) and the maximum torque of more than 418 N m (maximum output torque of the transmission in first gear),the price of motor is too expensive. So a transmission which the maximum transmission ratio between the load motor and test transmission is 3 is added so as to reduce the speed and torque of load motor requirements. Finally the specific parameters of the drive and load motor are shown in Table 1.
Parameters of the drive and load motor.
4.2.2 Data acquisition sensors
The data collection feedback system consists of a PT100 temperature sensor, two T40 series torque sensors, and two SJ1091 single channel gear speed sensors.
PT100 temperature sensor is mainly used for measuring temperature parameters in industry. The temperature sensor parameters of the bench are as follows: the accuracy grade is class A (the error is ±0.75 °C), and the measuring temperature range is −50 °C∼250 °C. The temperature sensor is installed at the bottom of the gearbox and is in contact with the lubricating oil directly. It is used to monitor the real-time changes of the oil temperature when the test bench is working.
The parameters of T40 torque sensor are shown in Table 2. The maximum input speed of transmission is 6000 rpm and maximum input torque is 108 N m. The parameters of input torque sensor can meet the requirements; the maximum output speed of transmission is 7425 rpm (transmission at fifth gear), the maximum output torque is 416 N m (transmission at first gear), the parameters of output torque sensor meet the use requirements.
The input speed sensor of the test bench is SJ1091 speed sensor. The measuring accuracy of speed sensor is 1 rpm and the measuring range is 0∼15,000 rpm which meets the requirement of input and output speed when the test bench is running. The input speed sensor is installed between the input torque sensor and test transmission input shaft. The output speed sensor is installed between the transmission output shaft and the output torque sensor. Therefore, the input and output speed of the transmission can be measured on the bench.
Parameters of T40 torque sensor.
4.2.3 Test transmission cooling system
A spray water cooling system is installed on the bench for controlling the oil temperature of the transmission lubricating oil, the schematic diagram is as shown in Figure 7. Water cooling system device is comprised of a water storage tank, flat sprinkler, an electromagnetic control valve, a water receiving disc and the water pipe. The sprinkler can cool the whole parts of transmission which assures the local temperature is not too high and the cooling system with low noise, low power and good environmental protection performance. The cooling system is automatically controlled. When the lubricating oil temperature of gearbox is higher than that of software settings, the water circulating pump is started, the electromagnetic valve is opened and the cooling water enters the sprinkler to cool the transmission. When the oil temperature is reduced to a setting temperature, the pump is closed.
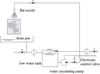 |
Fig. 7 Cooling system. |
4.2.4 Electrical system
The electrical system consists of the console, S120 frequency converter, the PLC, and corresponding connecting cables.
The console is consist of the industry personal computer, display, printer, etc.
In order to achieve accurate acquisition of the test data of the bench, the IPC installed the NI PCI-6221 data acquisition card produced by the American NI company which is responsible for the input and output of digital and analog signals. The NI data acquisition card measured the voltage value (0–10 V) where uses voltage value to indicate speed and torque size. For instance, if the input speed range of 0–6500 rpm, the corresponding voltage range is 0–10 V.
In order to simulate the real operation of transmission, the SIEMENS S120 drive control system which is a closed-loop control system is used to control the bench driving motor and the load motor. It is composed of a power cabinet, a filter cabinet, a rectifier cabinet and two inverter cabinets. The filter cabinet removes the clutter in the circuit, followed by the rectifier box transforming the three-phase alternating current into the direct current. Subsequently, when it enters the DC bus, the two inverter cabinets are respectively connected with the drive motor and the load motor.
4.3 Control of test stand
The internal communication and control principle of electrical system is shown in Figure 8 where IPC is in charge of controlling the bench. The NI PCI-6221 is responsible for the acquisition of analog signals and the output of digital switching signals. The IPC cannot communicate with PLC directly, hence using SIEMENS simatic.net's OPC software to achieve the function. The IPC receives the data which is collected by NI PCI-6221, then issues control commands. When the control signal is transmitted to the PLC, then PLC transformed and transmitted it to the S120 drive control system, to achieve the control of speed and torque.
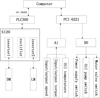 |
Fig. 8 Internal communication of the electric system. |
5 Comparative analysis of TE
5.1 Analysis of TE which is tested by bench
In order to study the relationship between TE of input speed, the input torque and the lubricating oil temperature. Under different oil temperature : 40 °C, 60 °C, 80 °C and 100 °C, different input rotational speed and torque, the TE is tested and analyzed.
When the transmission is in the fifth gear, the lubricating oil temperature is 40 °C, 60 °C, 80 °C and 100 °C respectively, three-dimensional diagram which is about TE changing with input speed and torque is shown in Figure 9.
As shown in Figure 9, when the lubricating oil temperature is 40 °C, 60 °C, 80 °C and 100 °C, the variation range of TE is about 92.5%–97.5%. The overall trend of TE in the four 3D graphs is that the lower right color is deep, the upper left color is shallow. The shallower color is, the greater the TE is. The deeper the color is, the smaller the TE is. So if the input torque is large and the input speed is small, the TE would be high. By a comprehensive comparison of the four picture, the TE increases gradually with the oil temperature as other variables remain unchanged, which is η40 °C<η60 °C<η80 °C<η100 °C. However, TE changes little when oil temperature is over 80 °C [11,12].
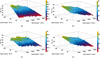 |
Fig. 9 TE changing with input speed and torque. (a) TE of 40 °C; (b) TE of 60 °C; (c) TE of 80 °C; (d) TE of 100 °C. |
5.2 The relationship between TE and input torque
In order to study the relationship between TE and input torque, the transmission with fifth gear, the lubricating oil temperature of 40 °C, 60 °C, 80 °C and 100 °C and the input speed of the input shaft is 3500 rpm are selected. How the TE changes with the input torque is shown in Figure 10.
Obviously, when the transmission is with the same gear, input speed and the lubricating oil temperature, its TE increases with the input torque gradually. The higher the oil temperature is, the greater the TE is. The reason is that when the oil temperature keep raising, the Kinematic viscosity of oil became small, so the total loss power decrease and TE increase.
For the convenience of observation, comparison and further analysis, the four scatterplots in Figure 10 is placed in the same coordination. As shown in Figure 11, comparing four different temperature curves of TE, it turns out that the lower the lubricating oil temperature is, the greater the change of TE is. When the oil temperature is at 80 °C and 100 °C, the TE values are similar, especially in the same torque [13,14].
When the transmission is with the fifth gear, the input speed is 3500 rpm, the range of TE is 92.5–97%, the TE increases with the input torque gradually. The bigger the input shaft torque is, the higher the TE is. With different lubricating oil temperatures of 40 °C, 60 °C, 80 °C and 100 °C, the TE is positively related to the input shaft torque. Comparing the TE in the condition of low and high input torque, it is easy to conclude, at the same temperature, the input torque influences the TE greatly. The TE in high input torque (108 N m) 1.5–2% is larger than that in the low input torque (54 N m).
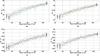 |
Fig. 10 TE changing with input torque. (a) TE of 40 °C; (b) TE of 60 °C; (c) TE of 80 °C; (d) TE of 100 °C. |
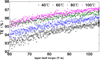 |
Fig. 11 TE changing with input torque at different temperature. |
5.3 Comparison of theoretical analysis and experimental test results
For the transmission is with fifth gear, input shaft speed is 3500 rpm, the input torque is 54 N m and fully loaded 108 N m, the data of TE which is theoretically calculated and tested by bench are compared and shown in Table 3.
According to the table above, the error of TE between theoretical calculation and test results is within 2% and most errors are less than 1% which is acceptable and could indicate the relative accuracy of the estimated results.
Comparison of theoretical analysis and experimental test results.
6 Conclusion
Comparing the TE between theoretical calculation and test results, it can be found that the relationship between the input torque and the TE is consistent by using these two methods.
-
When the gear, input speed and oil temperature keep constant, the total power loss and total input power are increased with the input torque. But the total power loss grows slowly. By contrast, ration between total power loss and total input power is gradually decreased, thus TE improves gradually.
-
The input torque has great influence on the TE. When other conditions keep consistent, the greater the input torque is, the higher the TE is. The TE in full load torque (108 N m) is 1.5–2% larger than that in the half load torque (54 N m).
-
Taking various factors into account, the operating temperature of gearbox which uses SAE75W90 lubricating oil is around 80 °C.
-
The error of TE between theoretical calculation and test results is within 2%. It indicates the estimated results are relatively accurate and the theoretical calculation can accurately reflect the change of TE in the real situation.
References
- M. Kolivand, S. Li, A. Kahraman, Prediction of mechanical gear mesh efficiency of hypoid gear pairs, Mech. Mach. Theory 45 , 1568–1582 (2010) [Google Scholar]
- H. Xu, Development of a generalized mechanical efficiency prediction methodology for gear pairs, The Ohio State University, Ann Arbor (2005) [Google Scholar]
- Y. Jun, The research on efficiency of gear transmission. Chang'an University, Xi'an (2013) [Google Scholar]
- J. Xi, X. Shen, X. Chen, Wear experiment and model of rolling balls in sliding-rolling conditions, Mech. Ind. 18 (2017) [Google Scholar]
- Z. Xie, Z. Rao, Theoretical and experimental research on the friction coefficient of water lubricated bearing with consideration of wall slip effects, Mech. Ind. 17 (2016) [Google Scholar]
- Z. Lizhi, Study on the key technology of a electrically closed transmission test-bench. Jilin University, Jilin (2010) [Google Scholar]
- W. Xi, Research on automobile fuel economy based on transmission efficiency. Chongqing University, Chongqing (2010) [Google Scholar]
- Gear handbook editorial board. Gear handbook (Volume 1)[M]. Mechanical Industry Press, Beijing (2002) pp. 2–154 [Google Scholar]
- K.F. Martin, A review of friction prediction in gear teeth. Wear 49 , 201–239 (1978) [Google Scholar]
- D. Sier, J. Qunyi, Principles of rolling bearing design [M]. China Standard Press, Beijing (2008) 26–108 [Google Scholar]
- S.S. Seetharaman, A.A. Kahraman, Load-independent spin power losses of a spur gear pair: Model Formulation. ASME Tribol. 131 , 022201 (2009) [CrossRef] [Google Scholar]
- L. Gan Fei, Study on the design of the measurement and control system of a DC-Bus electrically closed gear box test-bench, HeFei University of Technology, Hefei, 2007 [Google Scholar]
- S. Tian, G. Li, Research on transmission efficiency of mechanical transmission based on test bench. SAE Technical Papers, v2016-Octobeer; Conference: SAE International Powertrains, Fuels and Lubricants Meeting, FFL 2016, October 24, 2016–October 26, 2016, SAE International (2016); E-ISSN: 01487191; https://doi.org/10.4271/2016-01-2356 [Google Scholar]
- M. Yiming, C. Huiyan, G. Jianwei et al., Design and development of a real-time dynamic AMT test bench for simulating total road forces of vehicle. SAE Technical Papers, 2008 SAE International Powertrains, Fuels and Lubricants Congress; Conference: 2008 SAE International Powertrains, Fuels and Lubricants Congress, June 23, 2008–June 25, 2008. SAE International (2008) https://doi.org/10.4271/2008-01-1682 [Google Scholar]
Cite this article as: S. Yan, G. Li, S. Tian, Q. Zheng, Research on the relationship between transmission efficiency and input torque of manual transmission, Mechanics & Industry 20, 611 (2019)
All Tables
All Figures
|
Fig. 1 Internal structure diagram of transmission. |
| In the text | |
|
Fig. 2 Meshing process of an involute gear. |
| In the text | |
|
Fig. 3 TE calculation model. |
| In the text | |
|
Fig. 4 TE changes with the input torque. (a) TE of 40 °C; (b) TE of 60 °C; (c) TE of 80 °C; (d) TE of 100 °C. |
| In the text | |
|
Fig. 5 Ratio of total power loss to the total power. (a) Total loss power and total power change. (b) Loss power and total power ratio. |
| In the text | |
|
Fig. 6 Test bench. |
| In the text | |
|
Fig. 7 Cooling system. |
| In the text | |
|
Fig. 8 Internal communication of the electric system. |
| In the text | |
|
Fig. 9 TE changing with input speed and torque. (a) TE of 40 °C; (b) TE of 60 °C; (c) TE of 80 °C; (d) TE of 100 °C. |
| In the text | |
|
Fig. 10 TE changing with input torque. (a) TE of 40 °C; (b) TE of 60 °C; (c) TE of 80 °C; (d) TE of 100 °C. |
| In the text | |
|
Fig. 11 TE changing with input torque at different temperature. |
| In the text | |
Current usage metrics show cumulative count of Article Views (full-text article views including HTML views, PDF and ePub downloads, according to the available data) and Abstracts Views on Vision4Press platform.
Data correspond to usage on the plateform after 2015. The current usage metrics is available 48-96 hours after online publication and is updated daily on week days.
Initial download of the metrics may take a while.