| Issue |
Mechanics & Industry
Volume 22, 2021
|
|
|---|---|---|
| Article Number | 51 | |
| Number of page(s) | 18 | |
| DOI | https://doi.org/10.1051/meca/2021049 | |
| Published online | 22 December 2021 | |
Regular Article
Numerical investigation on the cooling performance of a novel jet cooler design for a supercritical CO2 turbine rotor shaft cooling
1
School of Mechatronics Engineering, Henan University of Science and Technology, Luoyang, Henan 471003, China
2
Henan Key Laboratory for Machinery Design and Transmission System, Henan University of Science and Technology, Luoyang, Henan 471003, China
3
School of Mechanical and Mining Engineering, University of Queensland, Brisbane, Australia
* e-mail: This email address is being protected from spambots. You need JavaScript enabled to view it.
Received:
24
August
2021
Accepted:
15
November
2021
Abstract
Numerical investigation was carried out to study the heat transfer performance for a high-speed rotating cylindrical surface subjected to single row array round jets impingement, under a very small gap spacing. Various parameters that affect heat transfer, such as the fluid density, flow velocity and Nusselt number distributions of the radius clearance were studied based on varied nozzle to target surface spacing H and mass flow rate. It has been found that the fluid density was a dominant factor and the velocity was the secondary factor for the gas jet heat transfer performances. The overall heat transfer was improved with a reduction in the number of nozzles, for given inlet mass flow rate boundary conditions. The decrease of H/di (di, nozzle diameter) may have positive or negative effects on the heat transfer performance from the impingement surface. Reducing the radius gap H, for a certainty, increases the average density of the fluid in the clearance, which is desirable in applications that enhance heat transfer performance. But when the radius gap (H) is small enough, increasing di may have a negative impact on heat transfer.
Key words: Gas jet impingement / heat transfer efficiency / cooling
© J. Li et al., Published by EDP Sciences 2021
 This is an Open Access article distributed under the terms of the Creative Commons Attribution License (https://creativecommons.org/licenses/by/4.0), which permits unrestricted use, distribution, and reproduction in any medium, provided the original work is properly cited.
1 Introduction
A heat engine converts heat to power. Heat engines using supercritical carbon dioxide (SCO2) Brayton cycles have the advantages of high efficiency, small physical footprint, simple layout, compact turbomachinery and heat exchanger, and can potentially be used in various power plants that use coal, geothermal energy, natural gas, solar and other energy sources. Compared to other energy conversion systems, a SCO2 Brayton cycle can achieve comparatively higher thermal efficiency within a moderate turbine inlet temperature range (450 − 600 °C) [1]. A major feature of the SCO2 Brayton cycle is its low pressure ratio because the turbine exist pressure needs to stay above CO2 critical pressure (7.38 MPa). SCO2 turbine exit pressures are much higher than gas turbines (0.1 MPa) or steam turbines (0.07 MPa) [2]. As the turbine outlet temperature is still high due to the low cycle pressure ratio, the seals and bearings need to be protected against high rotor temperatures. In this paper, it is proposed to cool the shaft before it is in contact with the seals by using a jet array around the shaft. The predictable novelty of this work is the exhaustive designing of cooler for SCO2 turbine rotor in concentrated solar applications. Especially in dry cooling technology applied in arid areas, it is preferable to design a dry cooler (Fig. 1) with a compact structure and high cooling efficiency.
Impinging jets are widely applied in many industrial applications such as the cooling of gas turbine blades, the drying of food, and the heating of glass products [3]. Impinging jets have relatively large heat transfer rates. And the heat transfer coefficient can be adapted to different actual engineering needs by controlling the flow parameters or the geometric structure of the flow field. Jets from a set of nozzles usually impact normally on the target surface. Numerous numerical and experimental studies of the single and array round impinging jets have been conducted over the years because of their diverse applications [4–9]. Nevertheless, study of impinging jets is still an active research area due to their complexity and economic importance.
Previous research focused on the effects of the nozzle exit Reynolds number (Re), dimensionless nozzle-to-plate spacing (h = H/di, di is the inner diameter of the jet nozzle, h is the non-dimensional separation distance of jet exit to impingement surface), the vortex flow flow on the localized Nusselt number (Nu), and effects of the structure of the nozzle on impinging jet heat transfer. In order to improve the heat transfer rate and to distribute heat convection more evenly over the impact surface (which is necessary in some industrial applications), various nozzle configurations, as well as defining flow control scheme, have been imposed and investigated in prior studies. The active control methods include imposing swirling annular impinging jet, low frequency pulsating jet impingement and adding nanoparticles excitations to alter the impinging jet flow features [10–18]. Passive controls can be achieved by applying array jet impingement and designing the outlet nozzle structure (such as feedback free sweeping jet) [19–22].
The single row jet array configuration can be implemented easily by arranging the nozzle along the circumferential direction of the rotating axis, and passively change the flow characteristics through the interference between jets. Previously, many investigations have been performed on the array impinging jet flow and associated heat transfer performance. Numerical studies were conducted by Tepe [19] to investigate the thermal convection characteristics of the staggered array jet impingement (SAJ) on a semi-circular concave surface. He observed that larger local Nu number and average Nusselt Nu number could be achieved for smaller dimensionless nozzle-to-plate spacing and elongated jet nozzle could enhance heat transfer of jet array. Salem et al. [23] presented both experimental and numerical studies of different nozzle configurations (in-line and staggered) impinging jet array heat transfer from target plane for two different Reynold numbers (Re = 1500 and Re = 2000). They observed that for the peak values of the averaged Nusselt number (Nu) decrease with increasing nozzle stand-off distance. Marzec [24] investigated the effect of axial nozzle position on cooling of complex surfaces to achieve the most effective Nu distribution. Tepe et al. [25] investigated the influence of extended jet arrays on the convective heat transfer capability of the in-line axis array jet impingement. Their numerical and experimental results revealed that extending jet array nozzles enhanced both local and average Nusselt numbers (Nu) on the flat surface. Lapka et al. [26] examined the fluid flow and heat characteristics during impingement of an array of microjets. The results show that the optimal ratio of the nozzle-to-plate spacing to the microjet inner diameter, in the subsonic flow, was analyzed to be H/di = 25. One of the cases of analogous work is the publication of Gurgul et al. [27]. They analyzed the phenomena of the turbulent flow array of ten mini-jets impinging a heated cylindrical surface. The investigations show that the minijet array lead to the intensification of heat transfer.
The SCO2 Brayton cycle layouts require relatively high turbine inlet temperatures (723 − 873 K) and high-pressures (>7.38 MPa). The cycle efficiency increases with increasing inlet temperature. Using existing bearing and seal technologies, employment of higher turbine inlet temperatures increases the demand on the rotor shaft cooling [28]. Position and size of the cooling jets is limited by surrounding components, thermal expansion of journal, and vibrations occurring during the turbine operation. Expanding the cooling capacity requires a profound understanding of the geometric parameters of jet array and airflow properties. The purpose of the present paper is to develop this understanding. A better understanding of the convection heat transfer efficiency of in-line array jet impingement cooler (AJC) and in-depth exploration of the flow, the heat and mass transfer efficiencies in impinging jet arrays would contribute to the development of active flow control schemes that could be of benefit for many industrial applications. The performed work focuses on the single row jet array and heat transfer on the impinging rotating shaft surface as seen in Figure 1.
 |
Fig. 1 SCO2 turbine shafting structure diagram. |
2 Thermo-flow model of curved surface impinged by round jet
2.1 CFD model and numerical solution procedure
The CO2 flow in micro and moderate radius clearance between the shaft surface and the confinement boundary was generated by significant pressure difference between nozzles and its outlets. A physical model of the computational domain and related boundary conditions are depicted in Figure 2. Numerical simulations were performed with ANSYS Fluent software using a SST k-omega (k − ω) with viscous heating turbulence model. Real gas properties were used. The target surface is the coupling interface of carbon dioxide fluid and rotor. An isothermal no-slip boundary condition was assumed with the rotor surface and adiabatic condition for the outer wall. Circular nozzles are used and they are evenly arranged along the circumference of the shaft. Many different combinations of boundary conditions and nozzle diameters and placements were considered as listed in Tables 1 and 2. The nozzle exits are oriented normal to the rotor shaft surface and the gas evacuates along the rotor axis direction.
 |
Fig. 2 Schematic of considered cooler geometry (with shaft). |
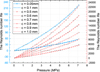 |
Fig. 3 Reynolds number distribution vs parameters. |
Boundary conditions for the numerical study.
Parameter range of cooler for the numerical computation.
2.2 Governing mathematical equations
The governing equations in the computation are the Reynolds-averaged mass, momentum, and energy. The equations with steady-state compressible fluid properties are expressed as:
Continuity equation: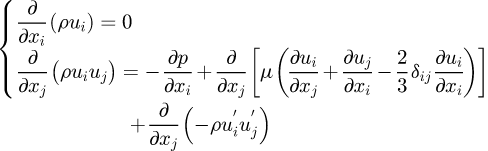 (1)
(1)
Momentum equation: (2)where
  is Reynolds stress denotes the effect of turbulence [29], u is the velocity, u′ is the turbulent velocity, p is the pressure, μ is the dynamic viscosity, ρ is the density.
Energy equation: (3)where, i, j, k = 1, 2, 3 are indices of Cartesian axes, cp is the specific heat, T is the temperature, κe is the effective thermal conductivity, and Prt is the turbulent Prandtl number, E is total energy,
  is the deviatoric stress tensor [22,30]. The above equations will be closed by the SST k − ω model. The standard k − ω model has the characteristics of near-wall stability and sensitivity to adverse pressure gradient. The k − ϵ model has the advantage of independence from the boundary layer. Menter [31] introduced hybrid functions to combine the two models into one, and developed k − ω into the shear stress transport model (SST k − ω). The improved SST k − ω model is more accurate and reliable over a wide range of flows than its standard form. The experimental and numerical results of preliminary investigation of previous studies, devoted to an array jet impingement analysis, revealed that the ideal turbulence model does not exist [27]. However, as many studies have concluded, SST k-omega turbulence model shows reasonably admissible performance and Nul distribution is relatively good agreement with the experimental results in jet impingement investigation [19,22,26]. Refer to [31] for a detailed introduction of the SST k − ω model.
The Reynolds number of nozzles is defined as follows: (4)where ρ is the CO2 fluid density, kg/m3; v is the average velocity at the inlet of nozzles, m/s; di is the nozzle diameter, m; and μ is dynamic viscosity, Pa ⋅ s; q mass flow rate, kg/s; Ni is number of nozzles. For lubrication flow and eccentric annular rings, the Reynolds number is expressed as
 (5)where u = 78.54m/s is the rotor working speed and L = 30mm is the width of the hydrostatic zones, c is the radius gap. Here, constant fluid temperature at the extreme case are represented by T = 330 K. The Re in equation (5) are depicted in terms of the lines with symbols in Figure 3. These data represent the turbulence intensity (I) and can be used as a reference for setting boundary conditions. The I determined by [32]
The dimensionless convective heat transfer rates along the cooled rotor surface are defined in terms of the Nusselt number, and the local Nusselt number (Nul) can be calculated as: (6)
(6)
Averaged Nu number can be determined as: (7)where kc represents the thermal conductivity of the rotor material. The term h is the average heat transfer coefficient obtained by numerical computation [29]. The average heat transfer coefficient is defined as
 (8)
(8)
2.3 Grid refinement
In this current study, since the computations were performed with SST k-omega turbulence model, the near wall functions are automatically selected according to the Y-plus on the target surface [30]. Furthermore, as the surface boundary mesh is refined, near-wall disposal will automatically transform from near wall functions to a low Re number near wall formulation. To take advantage of the systematic transformations and adaptive wall functions, but also to minimise switching errors, the element size of mesh and the boundary layer near the thermal coupling surface are successively refined. Average Nusselt number Nu and Y-plus on cylindrical surface at Hmax = 15 mm, di = 4 mm, n = 50000 rpm and extreme boundary conditions of Δp = 2.9MPa (mass flow rate q = 0.735kg/s) were investigated for the validation. The transition ratio of first boundary layer is 0.05. The gradual convergence procedures of the predicted average Nusselt number and Y-plus on the surface with mesh refinement are shown in Figure 4. It can be noticed that no significant deviation in the average Nusselt number between Δm = H/20 and Δm = H/30. Additionally, Y-plus falls below 10, which satisfies a low-Re near wall formulation or the wall-functions conditions of automatic near-wall treatment. Therefore, grid size of Δm = H/25 mm was used for all mesh generations.
 |
Fig. 4 Grid independence study. |
3 Results and discussion
This section presents the heat transfer of the rotor surface for different configurations shown in Table 2. The physical meaning of the Nusselt number is a criterion indicating the intensity of convective heat transfer. Therefore, the heat transfer efficiency are evaluated in terms of the calculated Nusselt number (Nu) as defined in equations (6) and (7).
3.1 Effect of nozzle number and rotor speed
The effects of different number of nozzles in a single row around the shaft on the thermal performance of jet impingement are shown in Figure 5. The height of each nozzle is 2 mm and located at the angular spacing of Δα = 2π/Ni (Fig. 2).
Figure 5 depicts the variation of Nu with nozzle coverage rate Nidi/C (where C = πD) involving outlet pressures po = 2.5MPa, 3.5MPa and 4.5MPa. In general, the Nu is found to decrease with increasing Nidi/C, although the average Nusselt value fluctuates around the maximum (Ni = 30) and minimum (Ni = 8) number of nozzles. And, the overall trend observed was similar for different po and H values. Referring to equation (4), this result also indicates that the Nu is positively correlated with the Reynolds number Re at the jet exit.
The local heat transfer coefficient (hl) contour maps for multiple-nozzle configuration with various outlet pressure (po = 2.5 MPa, po = 3.5 MPa, and ρ o = 4.5 MPa) are depicted in Figure 6. These iso-surfaces are normal views on the surface of the cylindrical shaft, corresponding to the cases of nozzle diameter di = 2 mm, shaft diameter D = 30 mm and mass flow rate q = 0.19 kg/s. Top-down is the axis direction of the rotor, horizontal is the circumferential direction of the rotor. The hl field development near the nozzles can be clearly recognized by the normal view presented. Consistent with the conclusions given by Incropera in his book [33], the gas jet has global and local maximum values of heat transfer coefficient around the nozzle. In the case of cooling shaft, the heat transfer coefficient near the nozzle is no longer symmetrically distributed along the unwrapped circumference of the shaft. It can be inferred that the gas velocity is enhanced and weakened by the surface velocity of the shaft in two directions, respectively. The heat transfer range of the jet is enlarged along the direction of rotation speed. Against the direction of rotation speed, the wall jet area is reduced, but the heat transfer in this area is enhanced. At the inlet condition with constant mass flow rate q, the heat transfer efficiency is observed to enhance with the increase in the outlet pressure from 2.5MPa to 4.5MPa. It is discernible from these figures that the additional nozzles (Fig. 6d) significantly weakens the convective heat transfer intensity but and increases the heat transfer uniformity, compared to the case of 8 nozzles (Fig. 6b). In a gas jet cooler, flow is impinged to the rotor surface at high speed through the circular arranged nozzles in the confinement boundary. Then, part of the fluid is redirected by the rotor surface velocity after impinging on the target surface and evacuates towards the streamwise direction in the radius gap. Rotor speed creates a crossflow around the nozzle in the radius gap against the jet flow (Fig. 7). In this study, the rotation speed of the rotor defaulted to 50,000 RPM unless otherwise specified.
The common feature present in all four heat transfer coefficient graphs (Fig. 6) is the presence of the asymmetry of the heat transfer intensity around the nozzle. As the direction of the fluid velocity at exit the nozzle changes on the surface of the shaft, the velocity of the crossflow gradually decreases towards the direction opposite to the rotation of the rotor with the addition of subsequent jet flows (Fig. 7b). Therefore, downstream jets (the jet direction around the nozzle is consistent to the direction of the shaft speed) are subject to relatively stronger cross-flow compared to upstream jets (the jets direction around the nozzle is opposite to the direction of the shaft speed). Compared with Figure 7a and 7b, it can be found that the strong encounter between rotor shaft speed and cross-flow intensifies the local heat transfer by varying the magnitude of jet velocity, especially in designs with large outlet pressure (po = 3.5 MPa, po = 4.5 MPa). For instance, surface average Nusselt number Nu enhanced by 5.98% relative to n = 0 rpm (Nu = 37970.05) at n = 50 krpm (Nu = 40242.79) for Po = 4.5MPa.
 |
Fig. 5 Variation trend of Nu with Nidi/C, di = 2 mm, q = 0.19 kg/s. (a) H/di = 0.1. (b) H/di = 0.25. (c) H/di = 0.5. (d) H/di = 1. |
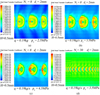 |
Fig. 6 The heat transfer coefficient contour maps with various outlet pressure. (a) Ni = 8, po = 2.5MPa. (b) Ni = 30, po = 3.5MPa. (c) Ni = 8, po = 4.5 MPa. (d) Ni = 30, po = 3.5 MPa. |
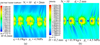 |
Fig. 7 Heat transfer coefficient vs flow velocity distributions. (a) Surface heat transfer coefficient. (b) Distribution of the flow velocity. |
3.2 Effect of H/di on the average heat transfer
The purpose of the implemented study was to examine various configuration parameters of the cooler directed perpendicularly to the shaft surface to find solution with a non-inferior optimal heat transfer performance. If the total mass flow rate q between the confinement boundary and shaft surface remains constant, cross-flow become an important factor that significantly affects the convective heat transfer performance on the fluid-solid coupling surface. Heat transfer on the shaft surface take place mainly by jet impingement around the nozzle region.
Variation trend of Nu on the cooling zone for the normal single row surrounded gas jet were also assessed in this study to exhibit the effect of H/di on heat transfer performance of cooler. Comparison of Nu variation trend over radius gap (H) with different outlet pressure (po = 1.5 MPa, po = 2.0 MPa, po = 2.5 MPa, po = 3.5 MPa, po = 4.5 MPa) are presented in Figure 8. When H/di = 0.067 (H = 0.2 mm), the Nu is the largest for all case of po. And, the lowest overall heat transfer efficiency was acquired on H/di = 0.67. The tendency of the Nu related to nozzle number Ni is clearer compared to that of the Nu related to H/di. It is obvious that convection heat transfer performance of a narrow radius gap (H) impinging jet is higher than that of the a large spacing impingement, although increasing the nozzle-to-surface spacing H can also promote the enhancement of the average Nusselt number to a certain extent, as shown in Figure 8.
Figure 9 shows that hermal performance becomes worse with the increase of nozzle diameter (in this case, H/di decreases). Therefore, increasing di may not be considered as a feasible application to reduce dimensionless nozzle-to-surface spacing H/di for a single row array gas jet on a cylindrical surface. Comparison of average Nusselt number between nozzle configuration of di = 5mm array jet impingement and di = 7 mm array jet impingement with variation of outlet pressure are presented in Figure 10. As it is distinctly seen that enlarging di increased the average Nu number for all outlet pressure boundary conditions in the figure. As the radius clearance gets narrower, flow heat transfer performance become more complex in the cross flow region. Comparison of Figures 9 and 10, it can be found that the conclusion that the thermal performance of jet impingement improves with the decrease of the dimensionless nozzle-to-surface spacing (H/di) made in the previous literature [3,8,30] may no longer be applicable in the industrial application of small gaps (for instance H = 0.2 mm) gas jet impingement. Depending on nozzle to rotor surface spacing H, the decrease of H/di may have positive or negative effects on the heat transfer performance from the impingement surface. Reducing the radius gap H, for a certainty, increases the average density of the fluid in the clearance, which is desirable in applications that enhance heat transfer performance. But with larger nozzle diameters, the picture is less clear.
 |
Fig. 8 Effect of H/di (di = 3 mm) on the Nu with different outlet pressure po. |
 |
Fig. 9 Effect of H/di (H = 0.2 mm) on the Nu with different outlet pressure po. |
 |
Fig. 10 Comparison of the Nu between di = 5 mm and di = 7 mm. |
3.3 Factors affecting thermal performance
Heat transfer in jets impingement is of interest due to its complex flow characteristics and industrial applications. To investigate the factors of contribution on heat transfer efficiency, the nozzle to the shaft surface distance was selected as the representative spacing of H = 0.05 ∼ 1 mm. The average Nusselt number (Nu) on the shaft surfaces for several outlet pressure (po = 2.0 MPa, po = 2.5MPa, po = 3.5 MPa, po = 4.5 MPa) are presented in Figure 11. First of all, at a given inlet mass flow rate, higher Nu directly indicates better heat transfer performance with increasing outlet pressure. Overall heat transfer on the interface enhanced by narrowing H at the condition of constant mass flow rate q inlet, as shown in the figures. In addition, the narrowing in H contributed to the increasing of average flow velocity (v) and average fluid density (ρ) in the radius gap. The v and ρ are positively correlated with the Nu.
Figure 12 shows the comparison of the Nu of the interface with extremely narrow radius clearance H = 0.1 mm and H = 0.05 mm. The Nu value are closely related with the H. After the jets impinge on the cylindrical wall, the curved surface jet developed toward both outlet and streamwise directions, followed by part of the gas flowing along the curved surface and interacts with the wall jet due to velocity of shaft surface. Accordingly, the high heat transfer zone was relocated toward the direction opposite to the rotor rotation (Fig. 13). Figures 14 and 15 shows the distributions of the velocity and density for H = 0.1 mm and H = 0.05 mm in the wall jet region, respectively. As can be seen here a further narrowing of the radius clearance would cause a uniform increase in the density and attenuation in velocity of the jets and the additional local density extremums are formed. The narrower the radius gap H, the smaller the difference in the rate of heat transfer change depending on the outlet pressure. However, it cannot be considered that performance of overall heat transfer will be enhanced with increasing of flow velocity and density, for now. Narrowing of radius clearance H may also increase the intake power and the cooling cost.
The increase in the nozzle diameter leads to an additional Reynolds number Re variation for the flow. Therefore, it is significant to evaluate the effect of fluid density and flow velocity in the radius gap and compare the results with different nozzle-to-surface spacing (H). The correlations between Nusselt number and flow velocity and fluid density are depicted in Figures 11, 16 and 17 respectively. The ρ and v in the figures are still the average density and average velocity of fluid between the rotor surface and confinement boundary. Figures 11 and 16 show that the average density increases with the increase of outlet pressure, while the average velocity is the opposite. Generally, when the inlet mass flow rate increases, the overall heat transfer performance is enhanced. However, for practical reasons such as gas supply mode, inlet pressure boundary conditions is necessary. Hence, the derivative of the surface average Nusselt number with respect to the inlet mass flow rate (∂Nu/∂ q) is a measure of thermal efficiency. The larger the ∂Nu/∂ ρ, the higher the utilization rate of the gas.
It is interesting to note that the ∂Nu/∂ q was larger in the case of low inlet pressure (corresponding to a small mass flow rate) impingement than that of high inlet pressure (corresponding to a larger inlet mass flow rate) impingement (Fig. 18). This tendency is contrary to the original intention of improving the inlet pressure to increase the heat dissipation efficiency. It can be explained that the overall heat transfer effect is enhanced with the increase of inlet pressure due to the increase of fluid density in the radial gap (Figs. 17 and 18a). However, the derivative of the fluid velocity with respect to the mass flow (∂v/∂ q) decreases with the increase of the inlet pressure. And as shown in Figure 18b, the decreasing trend coincides with the ∂Nu/∂ q. With the increase of pressure difference Δp between inlet and outlet, the ∂ρ/ ∂ q increases, while the ∂Nu/∂ q and ∂v/∂ q decreases, at the radial clearance H remains constant. But the overall heat transfer performance is still increased as the mass flow rate increases. As the results, the fluid density was established to be a dominant factor and velocity to be secondary for the heat transfer performance of the narrow clearance gas jet. For higher pressure differences (between inlet and outlet), the average Nusselt number and average fluid density are increased, however, the utilization rate of the gas decays (the ∂Nu/∂ q decrease) as the total mass flow rate increases.
 |
Fig. 11 Comparison of the average Nusselt number variation trend with that of fluid density and velocity, di = 3 mm, q = 0.051 kg/s. (a) Nu vs flow density, po = 2.0 MPa, (b) Nu vs flow velocity, po = 2.0 MPa, (c) Nu vs flow density, po = 2.5 MPa, (d) Nu vs flow velocity, po = 2.5 MPa, (e) Nu vs flow density, po = 3.5 MPa, (f) Nu vs flow velocity, po = 3.5 MPa, (g) Nu vs flow density, po = 4.5 MPa, (h) Nu vs flow velocity, po = 4.5 MPa. |
 |
Fig. 12 Variations in the Nu with outlet pressure (po) for H = 0.05 mm and H = 0.1 mm. |
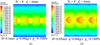 |
Fig. 13 Comparison of the density distribution between H=0.1mm and H=0.05 mm. (a) H=0.1 mm. (b) H=0.05 mm. |
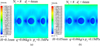 |
Fig. 14 Comparison of the velocity distribution between H=0.1mm and H=0.05 mm. (a) H=0.1 mm. (b) H=0.05 mm. |
 |
Fig. 15 Comparison of the heat transfer coefficient distribution between H=0.1mm and H=0.05 mm. (a) H=0.1 mm. (b) H=0.05 mm. |
3.4 Heat transfer
The temperature distribution of shaft was investigated. The impinging jets were tested with a solid shaft (shown in Fig. 19) heated amongst along the right-hand end. The temperature of the heat source is 1073 K. It is shown that a flow with inlet pressure of 0.8 MPa reduces the free end to an average temperature of 350.32 K. The heat transfer between the shaft and the fluid can be seen with a gradually decreasing thermal gradient (from right to left along the axis) inside the shaft. Demonstrated in the figure is the basic principle for impingement heat transmission that a stream impacts directly onto the target surface with thermal boundary layers to transfer heat efficiently.
Flow from the annular region moves through the nozzles to the radial clearance. Conjugate heat transfer is directly affected by the inlet pressure. Increasing the inlet pressure may increase the overall heat transfer coefficient by causing a larger mass flow rate (q) in the radial clearance, it may also increase the heat transfer coefficient by increasing the fluid velocity. Figure 20 demonstrates the average temperature of shaft free end over the investigated mass flow rate range for the configuration of 16 nozzles (16-jet). It is depicted that the average temperatures decays faster at lower pressures. But, the (∂Tav/∂ ps) no longer shows significant attenuation after a certain threshold inlet pressure (approximately 0.9 MPa) is reached. Once this happens in actual engineering, as the mass flow rate increases further, the system's mass flow rate utilization rate decrease sharply with a corresponding increase in pressure. This is not desirable because it may waste a lot of energy while enabling the hydrodynamic pressure effect to be aggravated.
 |
Fig. 16 Variation of average Nusselt number Nu and fluid density r as functions of outlet pressure po, di=6 mm, q=0.06 kg/s. (a) H=0.1 mm. (b) H=0.05 mm. |
 |
Fig. 17 Variation of average Nusselt number Nu and flow velocity v as functions of outlet pressure po, di=6 mm, q=0.06 kg/s. (a) H=0.1 mm. (b) H=0.05 mm. |
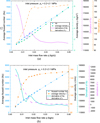 |
Fig. 18 Comparison of the average Nusselt number between density effect and velocity effect with different inlet pressure, H=0.2 mm, di=2 mm, po=0.1 MPa. (a) Average Nusselt number Nu vs fluid density r, (the raw data are attached in Tab. A1). (b) Average Nusselt number Nu vs flow velocity v. (the raw data are attached in Tab. A2). |
 |
Fig. 19 Temperature contours of the flow and shaft domain showing the heat dissipation of the CO2 flow for 16-jet at ps = 0.8 MPa. |
 |
Fig. 20 Average temperature distribution of free end vs inlet pressure for 16-jet. |
4 Report of an experiment
4.1 Experimental setup for thermographic
Figure 21 shows the experimental setup for temperature measurement. The temperature distribution images were captured by the infrared thermal imager. The disc was connected with shaft for heat transfer. The disc was heated by an electromagnetic induction device with a power of 2.2 kW. The disc was 100 mm in diameter and demonstrated a rotation speed of 50000 rpm. Cooling gas is supplied to the cooling device by pipeline (gas inlet). A thermocouple and a pressure sensor measure the true pressure and temperature of the gas in the annular tube (Fig. 2), respectively.
 |
Fig. 21 Experimental setup for infrared thermographic thermometry. |
4.2 Measurement result
The experimental conditions measured by the sensors and images for temperature distribution on the discs and shaft are presented in Figure 22. As the air jet impinges on the shaft, the temperature field of heated discs change. Figure 22a and 22b shows the forward view of the temperature distribution at the cantilever end of the rotor, with the same boundary conditions for CFD and experiment. The development of surface temperature gradient can be clearly recognized from the temperature nephogram. In case of front view, the axial temperature gradient is divided into three ranges, corresponding to the shaft, the middle disc, and the large disc. In the temperature field, the abscissa line L1 represents the surface temperature of shaft and discs. When the temperature of the system stabilizes over a long enough time, it can be observed that the temperature of the middle disc decreases rapidly along the axial direction, whereas the temperature of the larger disc near the heating device seems to remains constant. The temperature field on the large disc is used for the thermal boundary conditions of CFD, as shown in Figure 9a and 9c. Therefore, the temperature change of the shaft is relatively gentle. Figure 22c compares the temperature distribution of L1 experimentally and numerically. The numerical results are basically in agreement with the experimental data. Both showed very similar trends and inflection point behavior. Inflection points appear where the diameter of the rotor changes. It is obvious that the discs also has a temperature gradient along the radial direction.
 |
Fig. 22 Comparison of experimental data and CFD results. (a) Numerical. (b) Experimental. (c) Experimental and numerical data on line L1. |
5 Conclusion
Numerical and experimental studies are presented to characterize fluid density and velocity distribution and convective heat transfer for the rotational cylindrical surface subjected to array gas jet impingement for a given inlet mass flow rate and outlet pressure. The SST k-omega turbulence model is selected for the numerical experiments after the performance evaluation of grid independence and numerical solution procedure. The purpose of this study is to improve the heat transfer performance of the array jet, especially sufficiently the mass flow utilization of the coolant. With the aims in mind, parameters such as the number of nozzles, pressure and the radius gap are studied in a sufficiently wide range. The derivative of Nu with respect to the mass flow rate is used as an important indicator to measure the utilization rate of the coolant, and a detailed quantitative inspection has been carried out. Infrared thermal imaging method was employed to examine the CFD studies of convective heat transfer. The numerical predictions are basically in agreement with the experimental data. The experimental study was revealed the numerical results of the temperature with a deviation of 4.25% for the minimum temperature and a deviation of −0.07% for the maximum temperature. The difference between the experimental and the numerical results was −14.46% for average temperature. Moreover, many combinations of radius clearance (H), nozzle diameter (di), outlet and inlet conditions, were discussed. The following conclusions were summarized from the study.
Results showed that reducing the number of nozzles around the shaft improved the convective heat transfer efficiency on the target surface. Within the range of parameters studied, a relatively high average Nusselt number Nu is obtained at Ni ⋅ di/C equal to 0.17 or 0.19, at a given inlet mass flow rate.
Results showed that rotational speed and cross-flow between two adjacent nozzles affected jet velocity distribution and bended the cross-flow towards direction of the rotation. Consequently, Nusselt number local peak on the shaft surface dislocated towards the direction opposite to the rotation of the rotor, and the corresponding local convective heat transfer performance is enhanced. On the other hand, surface velocity counteracted the mutual interaction between the jet and cross-flow on the other side (towards the direction of rotation) of the nozzle. Therefore, the high speed of the rotor does not have a huge impact on the overall heat transfer performance of the gas jet impingement. As an example, it can be seen from the results that the high-speed rotation (n = 50 krpm) of the rotor surface increases the Nu on the target surface by only 5.98% relative to n = 0rpm for the same boundary conditions.
Numerical computations showed that the velocity of the carbon dioxide gas on the impinging region decreased with narrowing nozzle-to-surface separation distance (H), but the average density of gas increases. This established why the narrowing radius clearance enhanced heat transfer performance on the surface of interest.
The numerical results showed that narrowing of H increased both overall Nusselt number on the impingement surface and pressure drop of the cooler, which means that more intake power will be consumed. Note again, the density in the radial gap increases but the flow velocity is attenuated. Therefore, H/di was investigated to present whether the gas jet impingement with extremely narrow radius clearance was feasible or not for the jet impingement cooler. As a result, gas jet impingement heat transfer for micro clearance H was primarily affected by the jet density ρ, while the flow velocity v effect was secondary, with higher fluid density yielding in better convective heat transfer performance. This tendency was observed for both H = 0.1 mm and H = 0.05 mm at inlet mass flow rate q = 0.06 kg/s.
The H/di has a strong complex effect on heat transfer. The overall heat transfer was enhanced as the jet-to-target spacing (H/di = 0.067 ∼ 0.33, di = 3 mm) decrease, across all inlet and outlet boundary conditions studied. However, the average Nusselt number for configuration of H/di = 0.029 ∼ 0.067 (H = 0.2 mm) have the opposite variation trend. On the other hand, for extremely micro spacing (H = 0.05 mm, di = 6 mm), at any specific pressure boundary conditions of the outlet, the Nu at the impingement surface are significantly bigger than that of H = 0.1 mm (di = 6 mm). Hence, for the gas jet impingement with narrow confinement boundary, the simple consideration of Reynolds number based on dimensionless spacing (H/ di) cannot reflect the real overall heat transfer characteristics of the flow field.
The increasing of pressure difference between inlet and outlet improved both overall heat transfer on the target surface and average density distribution in the clearance. However, relative to mass flow rate, the derivative of the average Nusselt number (Nu) on the target surface and average velocity in the clearance gradually decreases with the increase of the inlet mass flow rate q. As a result, the efficiency of mass flow utilization decrease as the inlet pressure ps increases for given outlet pressure po boundary conditions.
Declaration of competing interest
The authors declare that they have no known competing financial interests or personal relationships that could have appeared to influence the work reported in this paper.
Acknowledgments
This work is supported by the Special Project of Industrial Cluster in National Innovation Demonstration Zone (No. 201200210400) and the Program of Henan Center for Outstanding Overseas Scientists (No. GZS2018005). The authors would like to acknowledge the support from Henan Key Laboratory for Machinery Design and Transmission System. The authors wish to acknowledge also the turbine structure and guidance provided by the team of the University of Queensland, Australia.
Appendix A
Raw data used in Figure 18a.
Raw data used in Figure 18b.
References
- M.H. Ahmadi, M.A. Nazari, R. Ghasempour, F. Pourfayaz, M. Rahimzadeh, T. Ming, A review on solar-assisted gas turbines, Energy Sci. Eng. 6, 658–674 (2018) [CrossRef] [Google Scholar]
- Y. Ahn, S.J. Bae, M. Kim, et al., High-performance supercritical carbon dioxide cycle for next-generation nuclear reactors, Nucl. Eng. Technol. 47, 647–661 (2015) [CrossRef] [Google Scholar]
- A.H. Mohammed, E.H. Mouhammad, A.H. Hasan, M.K. Abed, S. Anas, A review paper on heat transfer and flow dynamics in subsonic circular jets impinging on rotating disk, Energy Rep. 6, 834–842 (2020) [CrossRef] [Google Scholar]
- M. Kim, D. Kim, E. Yeom, K.C. Kim, Experimental study on heat transfer and flow structures of feedback-free sweeping jet impinging on a flat surface, Int. J. Heat Mass Transfer. 159 (2020). DOI: 10.1016/j.ijheatmasstransfer.2020.120085 [Google Scholar]
- F.J.G. Ortiz, M.J. Salas, J.O. Casanova, Application of shear-thinning and shear-thickening fluids to computational fluid mechanics of high-Reynolds impinging turbulent jets for cooling engineering, Int. J. Therm. Sci. 162 (2021). DOI: 10.1016/j.ijthermalsci.2020.106753 [Google Scholar]
- P. Gil, J. Wilk, R. Smusz, R. Gałek, Centerline heat transfer coefficient distributions of synthetic jets impingement cooling, Int. J. Heat Mass Transfer. 160 (2020). DOI: 10.1016/j.ijheatmasstransfer.2020.120147 [Google Scholar]
- J. Kansy, T. Kalmbach, A.E. Loges, J. Treier, T. Wetzel, A. Wiebelt, Determination of effective heat transfer area on vertical surfaces subject to spray and impinging jet, Appl. Thermal Eng. 184 (2021). DOI: 10.1016/j.applthermaleng.2020.116303 [CrossRef] [Google Scholar]
- G. Sapra, S. Chander, Effect of operating and geometrical parameters of tangential entry type dual swirling flame burner on impingement heat transfer, Appl. Thermal Eng. 181 (2020). DOI: 10.1016/j.applthermaleng.2020.115936 [CrossRef] [Google Scholar]
- D.J. Erasmus, M. Lubkoll, T.W.V. Backström, Jet impingement heat transfer within a hemisphere, Heat Mass Transfer. 57, 1–18 (2020) [Google Scholar]
- S.M. Illyas, B.R.R. Bapu, V.V.S. Rao, Heat transfer and flow visualization of swirling impinging jet on flat surface using helicoid inserts, J. Vis. 21, 729–749 (2018) [CrossRef] [Google Scholar]
- P. Xu, B. Yu, S. Qiu, H.J. Poh, A.S. Mujumdar, Turbulent impinging jet heat transfer enhancement due to intermittent pulsation, Int. J. Therm. Sci. 49, 1247–1252 (2010) [CrossRef] [Google Scholar]
- J.L. Svantesson, M. Ersson, P.G. Jonsson, Effect of froude number on submerged gas blowing characteristics, Materials (Basel, Switzerland) 14 (2021). DOI: 10.3390/ma14030627 [Google Scholar]
- M. Raizner, R. van Hout, Effect of impinging jet pulsation on primary and secondary vortex characteristics, Int. J. Heat Mass Transfer 151, 14 (2020) [Google Scholar]
- S.M.H.B. Abadi, S. Zirak, M.R. Zargarabadi, Effect of pulsating injection and mainstream attack angle on film cooling performance of a gas turbine blade, Phys. Fluids 32 (2020). DOI: 10.1063/5.0029110 [Google Scholar]
- E. Svabenska, N. Pizurova, P. Roupcova, et al., Effect of shock wave on microstructure of silicon steel, Surf. Interfaces 20 (2020). DOI: 10.1016/j.surfin.2019.100415 [Google Scholar]
- S. Rakhsha, M.R. Zargarabadi, S. Saedodin, Experimental and numerical study of flow and heat transfer from a pulsed jet impinging on a pinned surface, Exp. Heat Transf.16. DOI: 10.1080/08916152.2020.1755388 [Google Scholar]
- S. Abishek, R. Narayanaswamy, Low frequency pulsating jet impingement boiling and single phase heat transfer, Int. J. Heat Mass Transfer. 159 (2020). DOI: 10.1016/j.ijheatmasstransfer.2020.120052 [CrossRef] [Google Scholar]
- M.A. Pakhomov, V.I. Terekhov, RANS simulation of the effect of pulse form on fluid flow and convective heat transfer in an intermittent round jet impingement, Energies 13 (2020). DOI: 10.3390/en13154025 [CrossRef] [Google Scholar]
- A.Ü. Tepe, Numerical investigation of a novel jet hole design for staggered array jet impingement cooling on a semicircular concave surface, Int. J. Therm. Sci. 162 (2021). DOI: 10.1016/j.ijthermalsci.2020.106792 [Google Scholar]
- M. Kim, D. Kim, E. Yeom, Measurement of three-dimensional flow structure and transient heat transfer on curved surface impinged by round jet, Int. J. Heat Mass Transfer 161 (2020). DOI: 10.1016/j.ijheatmasstransfer.2020.120279 [Google Scholar]
- N. Uddin, S.O. Neumann, B. Weigand, B.A. Younis, LES investigation of a passively excited impinging jet, Int. J. Heat Mass Transfer 165 (2021). DOI: 10.1016/j.ijheatmasstransfer.2020.120705 [CrossRef] [Google Scholar]
- A.Ü. Tepea, Ü. Uysalb, Y. Yetişkenc, K. Arslan, Jet impingement cooling on a rib-roughened surface using extended jet holes, Appl. Therm. Eng. 178 (2020). DOI: 10.1016/j.applthermaleng.2020.115601 [Google Scholar]
- A.R. Salem, F.N. Nourin, M. Abousabae, R.S. Amano, Experimental and numerical study of jet impingement cooling for improved gas turbine blade internal cooling with in-line and staggered nozzle arrays, Energy Resour. Technol. 143, (2020). DOI: 10.1115/1.4047600 [Google Scholar]
- K. Marzec, Influence of jet position on local heat transfer distribution under an array of impinging nozzles with non-planar contour of the cooled surface, Heat Transfer Eng. 42 1506–1521(2020) [Google Scholar]
- A.Ü. Tepe, Y. Yetisken, Ü. Uysal, K. Arslan, Experimental and numerical investigation of jet impingement cooling using extended jet holes, Int. J. Heat Mass Transfer 158 (2020). DOI: 10.1016/j.ijheatmasstransfer.2020.119945 [Google Scholar]
- P. Lapka, A. Cieplinski, A. Rusowicz, Numerical model and analysis of heat transfer during microjets array impingement, Energy 203, 9 (2020) [Google Scholar]
- S. Gurgul, T. Kura, E. Fornalik-Wajs, Numerical analysis of turbulent heat transfer in the case of minijets array, Symmetry-Basel 12 (2020). DOI: 10.3390/sym12111785 [Google Scholar]
- M.M. Ehsan, S. Duniam, J. Li, Z. Guan, H. Gurgenci, A. Klimenko, A comprehensive thermal assessment of dry cooled supercritical CO2 power cycles, Appl. Thermal Eng. 166, (2019). DOI: 10.1016/j.applthermaleng.2019.114645 [Google Scholar]
- F.P. Incropera, D.P. DeWitt, T.L. Bergman, A.S. Lavine, Fundamentals of Heat and Mass Transfer, John Wiley and Sons, Inc, New York 2010 [Google Scholar]
- F. Afroz, Sharif, Numerical investigation of heat transfer from a plane surface due to turbulent annular swirling jet impingement, Int. J. Therm. Sci. 151 (2020). DOI: 10.1016/j.ijthermalsci.2019.106257 [CrossRef] [Google Scholar]
- M.F. R., Influence of free stream values on k-ω turbulence model predictions, AIAA J. 1657–1659 (1992) [Google Scholar]
- ANSYS Inc., ANSYS Fluent Theory Guide (ANSYS Inc., 2019) [Google Scholar]
- I. FP, D. DP, B. TL, Fundamentals of Heat and Mass Transfer, John Wiley and Sons, New York, Inc, 2010 [Google Scholar]
Cite this article as: J. Li, H. Gurgenci, J. Li, Z. Guan, L. Li, Y. Xue, Numerical investigation on the cooling performance of a novel jet cooler design for a supercritical CO2 turbine rotor shaft cooling, Mechanics & Industry 22, 51 (2021)
All Tables
All Figures
|
Fig. 1 SCO2 turbine shafting structure diagram. |
| In the text | |
|
Fig. 2 Schematic of considered cooler geometry (with shaft). |
| In the text | |
|
Fig. 3 Reynolds number distribution vs parameters. |
| In the text | |
|
Fig. 4 Grid independence study. |
| In the text | |
|
Fig. 5 Variation trend of Nu with Nidi/C, di = 2 mm, q = 0.19 kg/s. (a) H/di = 0.1. (b) H/di = 0.25. (c) H/di = 0.5. (d) H/di = 1. |
| In the text | |
|
Fig. 6 The heat transfer coefficient contour maps with various outlet pressure. (a) Ni = 8, po = 2.5MPa. (b) Ni = 30, po = 3.5MPa. (c) Ni = 8, po = 4.5 MPa. (d) Ni = 30, po = 3.5 MPa. |
| In the text | |
|
Fig. 7 Heat transfer coefficient vs flow velocity distributions. (a) Surface heat transfer coefficient. (b) Distribution of the flow velocity. |
| In the text | |
|
Fig. 8 Effect of H/di (di = 3 mm) on the Nu with different outlet pressure po. |
| In the text | |
|
Fig. 9 Effect of H/di (H = 0.2 mm) on the Nu with different outlet pressure po. |
| In the text | |
|
Fig. 10 Comparison of the Nu between di = 5 mm and di = 7 mm. |
| In the text | |
|
Fig. 11 Comparison of the average Nusselt number variation trend with that of fluid density and velocity, di = 3 mm, q = 0.051 kg/s. (a) Nu vs flow density, po = 2.0 MPa, (b) Nu vs flow velocity, po = 2.0 MPa, (c) Nu vs flow density, po = 2.5 MPa, (d) Nu vs flow velocity, po = 2.5 MPa, (e) Nu vs flow density, po = 3.5 MPa, (f) Nu vs flow velocity, po = 3.5 MPa, (g) Nu vs flow density, po = 4.5 MPa, (h) Nu vs flow velocity, po = 4.5 MPa. |
| In the text | |
|
Fig. 12 Variations in the Nu with outlet pressure (po) for H = 0.05 mm and H = 0.1 mm. |
| In the text | |
|
Fig. 13 Comparison of the density distribution between H=0.1mm and H=0.05 mm. (a) H=0.1 mm. (b) H=0.05 mm. |
| In the text | |
|
Fig. 14 Comparison of the velocity distribution between H=0.1mm and H=0.05 mm. (a) H=0.1 mm. (b) H=0.05 mm. |
| In the text | |
|
Fig. 15 Comparison of the heat transfer coefficient distribution between H=0.1mm and H=0.05 mm. (a) H=0.1 mm. (b) H=0.05 mm. |
| In the text | |
|
Fig. 16 Variation of average Nusselt number Nu and fluid density r as functions of outlet pressure po, di=6 mm, q=0.06 kg/s. (a) H=0.1 mm. (b) H=0.05 mm. |
| In the text | |
|
Fig. 17 Variation of average Nusselt number Nu and flow velocity v as functions of outlet pressure po, di=6 mm, q=0.06 kg/s. (a) H=0.1 mm. (b) H=0.05 mm. |
| In the text | |
|
Fig. 18 Comparison of the average Nusselt number between density effect and velocity effect with different inlet pressure, H=0.2 mm, di=2 mm, po=0.1 MPa. (a) Average Nusselt number Nu vs fluid density r, (the raw data are attached in Tab. A1). (b) Average Nusselt number Nu vs flow velocity v. (the raw data are attached in Tab. A2). |
| In the text | |
|
Fig. 19 Temperature contours of the flow and shaft domain showing the heat dissipation of the CO2 flow for 16-jet at ps = 0.8 MPa. |
| In the text | |
|
Fig. 20 Average temperature distribution of free end vs inlet pressure for 16-jet. |
| In the text | |
|
Fig. 21 Experimental setup for infrared thermographic thermometry. |
| In the text | |
|
Fig. 22 Comparison of experimental data and CFD results. (a) Numerical. (b) Experimental. (c) Experimental and numerical data on line L1. |
| In the text | |
Current usage metrics show cumulative count of Article Views (full-text article views including HTML views, PDF and ePub downloads, according to the available data) and Abstracts Views on Vision4Press platform.
Data correspond to usage on the plateform after 2015. The current usage metrics is available 48-96 hours after online publication and is updated daily on week days.
Initial download of the metrics may take a while.