| Issue |
Mechanics & Industry
Volume 21, Number 1, 2020
|
|
|---|---|---|
| Article Number | 103 | |
| Number of page(s) | 6 | |
| DOI | https://doi.org/10.1051/meca/2019061 | |
| Published online | 07 January 2020 | |
Regular Article
An efficient method for estimating the damping ratio of a vibration isolation system
1
School of Mechanical and Electrical Engineering, University of Electronic Science and Technology of China, Chengdu 611731, PR China
2
Department of Mechanical Engineering, Tsinghua University, Beijing 100084, PR China
* e-mail: This email address is being protected from spambots. You need JavaScript enabled to view it.
Received:
17
October
2018
Accepted:
16
July
2019
Abstract
As the damping ratio determines the response of a vibration isolation system at resonance, it is very necessary to estimate the damping ratio quickly and economically for an evaluation of the effectiveness to adjust the damping in practical engineering applications. An efficient method named the “ζ-Tr” method with the characteristics of simple operation and a high accuracy is introduced to estimate the damping ratio in this paper. According to the transmissibility curve, the specific mathematical relationship in which the value of the resonance peak corresponds to the value of the damping ratio is analysed theoretically. In this case, the recognition of the resonance peak can be used to directly estimate the damping ratio without an approximation or simplification. The “ζ-Tr” method is faster, more accurate and less costly than other estimation methods. Finally, the correctness of the “ζ-Tr” method is verified by a simulation and an experiment.
Key words: Vibration isolation / damping ratio / estimation / resonance peak / “ζ-Tr” method
© AFM, EDP Sciences 2019
1 Introduction
Vibration isolation systems developed to prevent the transfer of vibrations are necessary for implementation of building structures, ultra-precision manufacturing and measurement, aerospace science, vehicle engineering and other fields [1–3]. In general, the harmful vibration energy imported by the environment or ground is mainly consumed by viscous damping in these systems. To simplify the theoretical analysis and numerical calculation, the damping model can similarly be considered in linear viscous form. The damping ratio is one of the key parameters in this linear model, and the estimation of the damping ratio is very important for accurately predicting the response of a vibration isolation system. The estimation methods are commonly known as the half-power bandwidth method and the time-domain attenuation method [4,5].
The procedure of the half-power bandwidth method [6,7] is shown in Figure 1. The damping ratio can be estimated by locating the half-power points and calculating the half-power bandwidth based on the measured transmissibility curve. This method is widely used because of its simplicity, but it may be influenced by many factors, such as the sampling frequency and the frequency resolution [8–10]. Moreover, this is a simplified and approximate method, so there are some errors between the estimated and actual results.
The procedure of the time-domain attenuation method [11,12] is shown in Figure 2. The damping ratio can be estimated by calculating the average attenuation rate based on measuring the time-domain attenuation curve by adding a single-frequency vibration excitation. The estimated results are very accurate, but the operational process is complex. In particular, the calculation of the average attenuation rate often needs to fit the envelope curve of the time-domain attenuation curve.
After measuring the transmissibility curve or time-domain attenuation curve, the above two methods still require further analysis or calculations before estimating the damping ratio. The half-power bandwidth method must locate the half-power points and calculate the half-power bandwidth shown in the “Step 3” in Figure 1. The time-domain attenuation method must calculate the average attenuation rate shown in the “Step 3” in Figure 2. During the course of the product design, product development, product installation and testing of any vibration isolators or isolation system, the damping ratio needs to be estimated rapidly multiple times to verify whether the design value meets the actual requirement. Furthermore, these further operations such as “Step 3” in the above two methods require necessary professional knowledge or skills, and ordinary employees may not complete these tasks. Thus, more money must be spent in employing senior employees, and more time must be taken to finish the estimation of the damping ratio.
In this paper, an efficient method for estimating the damping ratio is proposed by analysing the relationship between the resonance peak of the transmissibility curve and the damping ratio. Compared with the above two methods, the proposed method only needs the transmissibility curve, and the damping ratio can be estimated directly depending on the value of the resonance peak without extra operations like “Step 3” in Figure 1 or 2.
 |
Fig. 1 Procedure of the half-power bandwidth method. |
 |
Fig. 2 Procedure of the time-domain attenuation method. |
2 “ζ - T r” method for estimating the damping ratio
Typical passive vibration isolation systems can be reduced to a mass-spring-damper system as depicted in Figure 3, where m, k and c are the system mass, the system stiffness and the system damping, respectively.
The transmissibility curve, which is defined as the ratio of the output and the input, is often used to measure the performance of a mass-spring-damper system in the frequency domain. Through dynamic analysis, the motion equation of a passive vibration isolation system is derived, and then the transmissibility curve T(g) can be expressed as [4,13]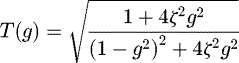 (1)and
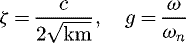 (2)
where ζ, ω, ωn and g are the damping ratio, forcing frequency, natural frequency and frequency ratio, respectively.
(2)
where ζ, ω, ωn and g are the damping ratio, forcing frequency, natural frequency and frequency ratio, respectively.
The variation in the transmissibility T(g) with the frequency ratio g is shown in Figure 4. It is obvious that T(g) is a convex function. Set the first derivative of T(g) to zero: (3)
(3)
Substitute equation (1) into equation (3) and further solve equation (3). The resonance frequency ratio gr shown in Figure 4 can be obtained: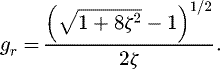 (4)
(4)
Substituting equation (4) into equation (1), the resonance peak Tr shown in Figure 4 can be obtained: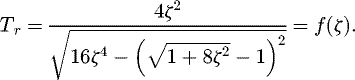 (5)
(5)
As shown in equation (5), the function f expresses a one-to-one relationship between the resonance peak Tr
and the damping ratio ζ. Conversely, if we can obtain the value of the resonance peak Tr
according to the measured transmissibility curve or the frequency response curve, the damping ratio ζ can be expressed as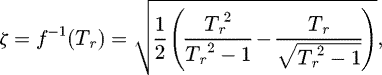 (6)where the function f −1 is the inverse function of f. Note that Tr
and ζ in equation (6) have no units. If Tr
recognized from the transmissibility curve has units of “dB”, a simple transformation must be made before calculating the damping ratio ζ by substituting the resonance peak Tr
into equation (6).
(6)where the function f −1 is the inverse function of f. Note that Tr
and ζ in equation (6) have no units. If Tr
recognized from the transmissibility curve has units of “dB”, a simple transformation must be made before calculating the damping ratio ζ by substituting the resonance peak Tr
into equation (6).
Furthermore, the variation in the damping ratio ζ with the resonance peak Tr is shown in Figure 5. Then, the damping ratio ζ can be estimated by a mathematical calculation method with equation (6) or diagramming method with Figure 5. These two methods are named the “ζ-Tr” method for short in the following parts. In this case, the “ζ-Tr” method can be directly used to estimate the damping ratio ζ based on the value of the resonance peak Tr, which can be obtained easily from the measured transmissibility curve. The procedure of the “ζ-Tr” method is shown in Figure 6, and the damping ratio can be estimated in only three steps. Both the half-power bandwidth method and the time-domain attenuation method require four steps and further work, such as locating the half-power points or calculating the average attenuation rate. Therefore, the “ζ-Tr” method is more efficient and has great importance in engineering practice for the estimation of the damping ratio ζ.
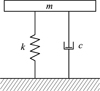 |
Fig. 3 Mass-spring-damper system. |
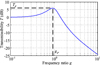 |
Fig. 4 Variation in T(g) with g. |
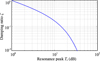 |
Fig. 5 Variation in ζ with Tr. |
 |
Fig. 6 Procedure of the “ζ-Tr” method. |
3 Comparison with the half-power bandwidth method
3.1 Simulation analysis
Through the above analysis, the estimation of the damping ratio using the “ζ-Tr” method is deduced directly without an approximation or a simplification and the estimation results have less error. To clarify this point, we perform further simulation analysis and a comparison with the half-power bandwidth method, as shown below.
Without loss of generality, we assume that the natural frequency ωn is 1 Hz. Then, we use MATLAB software to simulate the variation in the transmissibility T with the forcing frequency ω in the cases of a damping ratio of ζ = 0.01, 0.05, 0.1, 0.2 or 0.3, as shown in Figure 7. Because the natural frequency ωn is very low, the sampling frequency is just set to 10 Hz. Finally, based on the simulation results of the transmissibility curve, different damping ratios can be calculated by the half-power bandwidth method [8,9] and the proposed method using the “ζ-Tr” method. By comparing the calculated results with the standard values of the different damping ratios, the errors of these two different methods can be analysed. To analyse whether the frequency resolution affects the accuracy of the estimation of the damping ratio, we choose four different values of the frequency resolution: 10−4 Hz, 10−3 Hz, 10−2 Hz, and 10−1 Hz.
The calculation of the damping ratio ζ by the half-power bandwidth method is shown in Table 1. While the frequency resolution is 10−4 Hz or 10−3 Hz, the calculation errors are small, within 6.83%. However, while the frequency resolution is 10−2 Hz or 10−1 Hz, some of the calculation errors are even 200% or 25%, which can be unacceptable. In some cases, the half-power bandwidth may be non-existent so that the damping ratio is incalculable. This also demonstrates that this method can be influenced by the frequency resolution and that the estimation results are incredible in some conditions.
The calculation of the damping ratio ζ by the “ζ-Tr” method is shown in Table 2. While the frequency resolution is 10−4 Hz, 10−3 Hz or 10−2 Hz, the calculation errors are very small. While the frequency resolution is 10−1 Hz, the calculation errors are still less than 2%. On one hand, the calculation errors of the proposed method are all less than those of the half-power bandwidth method. On the other hand, regardless of how the frequency resolution or the damping ratio changes, we can also complete the calculation of the damping ratio.
The damping ratio ζ is set to 0.01, 0.05, 0.1, 0.2 and 0.3 because the half-power bandwidth method can only be applied to the situation in which the damping ratio ζ must be less than 1/2 . However, the “ζ-Tr” method has no limit to the value of the damping ratio ζ. Therefore, the “ζ-Tr” method not only reduces the estimation error of the damping ratio ζ but also has a wider range of applications.
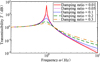 |
Fig. 7 Variation in T with ω for different damping ratios ζ. |
Calculation of the damping ratio ζ by the half-power bandwidth method.
Calculation of the damping ratio ζ by the “ζ-Tr” method.
3.2 Experimental analysis
The experimental platform shown in Figure 8 is a passive vibration isolation system consisting of six air spring isolators. The testing devices are an ultralow-frequency vibration pickup sensor 991B produced by Institute of Engineering Mechanics, China Earthquake Administration and a data acquisition instrument INV3060T produced by China Orient Institute of Noise & Vibration.
First, we beat on the load with a rubber hammer, and a time-domain attenuation curve in the vertical direction can be obtained. The measured curve for 5 s is shown in Figure 9, and the values of consecutive peaks are shown in Table 3. The average attenuation rate can be calculated: (7)
(7)
Then, the damping ratio of the isolation system in the vertical direction can be estimated using equation (8) [11].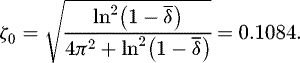 (8)
(8)
The above time-domain attenuation method is a very accurate approach. Therefore, the estimation result ζ0 can be regarded as the standard value of the damping ratio.
Finally, the measured transmissibility curve in the vertical direction is shown in Figure 10. The resonance peak Tr is 13.58 dB, and then we can estimate the damping ratio ζ1 and ζ2 by the half-power bandwidth method [5,6] and the new method using equation (6), respectively. These three estimation results of the damping ratio are shown in Table 4. It is obvious that the error of ζ2 is significantly less than the error of ζ1.
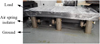 |
Fig. 8 Experiment platform supported by six air spring isolators. |
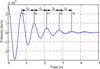 |
Fig. 9 Measured time-domain attenuation curve for 5 s. |
Values of 5 consecutive peaks.
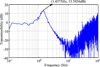 |
Fig. 10 Measured transmissibility curve in the vertical direction. |
Three estimated values of the damping ratio.
4 Conclusions
This paper has presented an efficient approach called the “ζ-Tr” method to estimate the damping ratio of a vibration isolation system whose damping model is linear. According to an analysis of the relationship between the resonance peak of the transmissibility curve and the damping ratio, a mathematical expression for the one-to-one correspondence between the resonance peak of the transmissibility curve and the damping ratio can be obtained. Then, the damping ratio can be estimated on the basis of the recognition of the resonance peak from the measured transmissibility curve. In contrast to other methods, the “ζ-Tr” method has little approximations, simplifications or limitations and requires fewer steps. Consequently, the estimation results are more accurate, and the “ζ-Tr” method is more efficient and easier to use in engineering applications.
Acknowledgments
This work was supported by Major Scientific and Technological Project of China National Machinery Industry Corporation Ltd (SINOMAST-ZDZX-2017-05), National Science and Technology Major Project (2013ZX02104003) and the Natural Science Foundation of Hubei Province (2018CFC889).
References
- M.G. Mostofa, J.H. Noh, H.Y. Kim, J.H. Ahn, D.B. Kang, Tooling device design for vibration-assisted high speed shaping of PMMA, J. Mech. Sci. Technol. 24, 1623–1629 (2010) [CrossRef] [Google Scholar]
- A. Rostami, Piece wise linear integrated optical device as an optical isolator using two-port nonlinear ring resonators, Opt. Laser Technol. 39, 1059–1065 (2007) [Google Scholar]
- R. Serra, Special issue on experimental vibration analysis, Mech. Ind. 18, 1–2 (2018) [Google Scholar]
- S.S. Rao, Mechanical vibrations, 4th edn., Pearson Education, New Jersey, USA, 2004 [Google Scholar]
- A.S. Phani, J. Woodhouse, Viscous damping identification in linear vibration, J. Sound Vib. 303, 475–500 (2007) [Google Scholar]
- P.J. Torvik, On estimating system damping from frequency response bandwidths, J. Sound Vib. 330, 6088–6097 (2011) [Google Scholar]
- G.A. Papagiannopoulos, G.D. Hatzigeorgiou, On the use of the half-power bandwidth method to estimate damping in building structures, Soil Dyn. Earthq. Eng. 31, 1075–1079 (2011) [CrossRef] [Google Scholar]
- H.Q. Ying, J.M. Liu, S. Shen, Half-power bandwidth method and INV damping ration solver study, Noise Vib. Control 26, 4–6 (2006) [Google Scholar]
- J.T. Wang, F. Jin, C.H. Zhang, Estimation error of the half-power bandwidth method in identifying damping for multi-DOF systems, Soil Dyn. Earthq. Eng. 39, 138–142 (2012) [CrossRef] [Google Scholar]
- K.F. Chen, Q.Y. Jiao, Influence of linear interpolation approximation to half power points on the damping estimation precision, J. Mech. Strength 24, 510–514 (2002) [Google Scholar]
- W. Sun, F. Qi, Q.K. Han, Estimating system damping for a hard coating composite structure based on envelope of a free damped vibration signal, J. Vib. Shock 32, 50–54 (2013) [Google Scholar]
- J. Wang, Y.L. Li, W.J. Shao, S.L. Lian, Damping ratio testing of steel spring floating slab based on free vibration, J. East China Jiaotong Univ. 32, 1–5 (2015) [Google Scholar]
- J. Huang, Control research of a tabletop active vibration isolation based on the PID algorithm, University of Electronic Science and Technology of China, Chengdu, China, 2014 [Google Scholar]
Cite this article as: Q. Yu, D. Xu, Y. Zhu, G. Guan, An efficient method for estimating the damping ratio of a vibration isolation system, Mechanics & Industry 21, 103 (2020)
All Tables
All Figures
|
Fig. 1 Procedure of the half-power bandwidth method. |
| In the text | |
|
Fig. 2 Procedure of the time-domain attenuation method. |
| In the text | |
|
Fig. 3 Mass-spring-damper system. |
| In the text | |
|
Fig. 4 Variation in T(g) with g. |
| In the text | |
|
Fig. 5 Variation in ζ with Tr. |
| In the text | |
|
Fig. 6 Procedure of the “ζ-Tr” method. |
| In the text | |
|
Fig. 7 Variation in T with ω for different damping ratios ζ. |
| In the text | |
|
Fig. 8 Experiment platform supported by six air spring isolators. |
| In the text | |
|
Fig. 9 Measured time-domain attenuation curve for 5 s. |
| In the text | |
|
Fig. 10 Measured transmissibility curve in the vertical direction. |
| In the text | |
Current usage metrics show cumulative count of Article Views (full-text article views including HTML views, PDF and ePub downloads, according to the available data) and Abstracts Views on Vision4Press platform.
Data correspond to usage on the plateform after 2015. The current usage metrics is available 48-96 hours after online publication and is updated daily on week days.
Initial download of the metrics may take a while.