| Issue |
Mechanics & Industry
Volume 26, 2025
|
|
|---|---|---|
| Article Number | 24 | |
| Number of page(s) | 9 | |
| DOI | https://doi.org/10.1051/meca/2025016 | |
| Published online | 05 August 2025 | |
Original Article
Experimental analysis of the leakage characteristics of an oil cooled electric motor L-shaped lip seal in high-speed conditions
1
IFP Energies nouvelles, Institut Carnot IFPEN Transports Energie, 1 et 4 avenue de Bois-Préau, 92852 Rueil-Malmaison, France
2
Dept of Fluid and Sealing technologies, Technical Center of Mechanical Industries (Cetim), 74 Route de la Jonelière, 44 326, Nantes, France
* e-mail: This email address is being protected from spambots. You need JavaScript enabled to view it.
Received:
14
April
2025
Accepted:
3
July
2025
Abstract
Over the past few years, electric vehicles have gained great popularity as a favored solution to cutdown greenhouse gas emissions. Moreover, the rise in the motor power density, as targeted in automotive roadmaps, would rely on improved machine designs, higher speeds and improved cooling solutions as direct oil cooling to extract the calories at the source improving as well the overall efficiency in operation. Nowadays, electric motors designed for vehicles exceed rotational speeds of 15 000 rpm aiming at 20 000 rpm and above. An effective solution to evacuate generated losses is direct oil cooling which requires an effective sealing solution limiting friction losses which impact the efficiency. Thus, PTFE L-shaped lip seals are commonly used to prevent oil leakage into the environment. Those seals are not only intended to retain oil in the electric motor, but they're also made to limit power losses over a wide range of rotation speed. In this work, leakage characteristics of PTFE L-shaped lip seals in different working conditions have been studied up to 15 000 rpm and compared to power losses measured directly on the motor. First, the effect of excitation time has been studied though friction torque and leakage flow rate. The results highlight a viscoelastic effect of the studied seal. In addition, oil cooling conditions, such as oil temperature or sprayed area, on seal's performance have been studied.
Key words: Lip seal / E-mobility / high rotation speed / oil lubrifaction / wear
© T. Valin et al., Published by EDP Sciences 2025
 This is an Open Access article distributed under the terms of the Creative Commons Attribution License (https://creativecommons.org/licenses/by/4.0), which permits unrestricted use, distribution, and reproduction in any medium, provided the original work is properly cited.
1 Introduction
The goal of new electric powertrain in automotive application is to provide more compact and efficient systems. Then, generated losses need to be evacuated efficiently by means of appropriate systems [1]. If multiple studies focus on the most efficient cooling technology [2–5], the losses induced by the component of such a system, and in particular dynamic sealing, must be qualified and possibly minimized. Lowering these losses not only increases the system's efficiency but also has a direct impact on battery range and cost. In [6] authors focused on power losses estimation of different components (ball bearing, airgap windage, iron losses, dynamic seals, …) in an electric motor with direct oil cooling (Fig. 1a). They highlighted that at low rotational speeds (lower than 5 000 rpm), the main total load-independent losses are due to the dynamic seals which are PTFE Lip seals (approximately 40% to 50% of the total power loss). For higher rotational speed, authors show that seals were the second main source of losses (around 20% of the total load-independent losses). However, in this study the seal's losses are not directly measured. Furthermore, the seal's behaviour in such electric motors is not entirely qualified due to the diverse operating conditions such as oil temperature, rotor rotational speed, lubrication, and others. Consequently, the present work will be focused on evaluation of the seal behavior, in terms of power losses and leakage, over a wide range of parameters. Given the complexity of the phenomena considered, it is necessary to isolate them in a controlled environment in order to identify the governing behavior laws.
As presented in Figure 2, the L-shaped lip seal comprises a PTFE lip mounted inside a metal housing rigidly fixed to the stator of the system. The sealing lip is around 1 mm thick and contacts the shaft axially over approximately 1.5 mm. Unlike usual automotive PTFE seals, where the lip presents a spiral cut to enhance hydrodynamic effect, the sealing lip of the studied seal is totally smooth. Table 1 summarized the main parameters relative to the studied seal. Figure 1b also presents the lip seal orientation with the chamber containing oil to be sealed. The seal's orientation in the electrical engine came from a potential slight pressure difference around the seal with higher pressure in the air side.
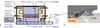 |
Fig. 1 General architecture of the electric motor in [6] (a) and representation of the seal environment (b). |
 |
Fig. 2 3D CAD view of the studied seal (a) and section view of a brand-new seal (b). |
Studied seal parameters.
2 The test rig
The test rig, presented on the CAD view of Figure 3, is composed of a rotor guided by a spindle entrained in rotation thanks to an electric motor of 5.5 kW with a maximum rotational speed of 6 000 rpm. To ensure high rotational speeds of the rotor (up to 30 000 rpm), a 1:5 gearbox connects this latter to the motor.
The test zone, on the right-hand side of Figure 3 and depicts in Figure 4, consists of a L-shaped lip seal mounted around the tested rotor (Ra 0.9 μm, Rq Rz 5.77 μm) and rigidly fixed to the test cell body. The latter is supported by two rigid cylinders acting as sliding pivot. Then, the axial position of the seal relative to the rotor is adjustable. Thanks to an adjustable nozzle, oil is projected around the sealing zone in the upstream chamber of the test cell. On the left-hand side of the tested seal, i.e. in the downstream chamber, teeth are machining on the rotor to centrifuge oil coming from the leak. The oil is then recovered using a leakage recuperator mounted on the test cell body.
Figure 5 depicts the hydraulic loop associated with the test rig. It is composed of a 5 L tank filled with mineral transmission oil. Oil is injected into the test cell at controlled temperature respectively thanks to a 120 W gear pump and 4.5 kW heater. A bypass circuit with a manual valve V01, mounted upstream of the heater, limits the oil flow rate in the direction of the test cell. After valve calibration, the oil flowrate injected into the test cell can be adjustable from 0.11 l/min to 0.22 l/min (depending on valve position). The adjustable nozzle has been designed to ensure the desired jet dynamic within the seal's upstream chamber. Thanks to a vent, mounted in the test chamber, tests are conducted at atmospheric pressure. Figure 6 shows a comparison between the desired (CFD analysis) and the obtained dynamic.
The temperature of the injected oil is actively controlled by means of a dataset obtained from a 1 K-type thermocouple (+/−1°C) located downstream of the heater, within the oil circuit. In addition, as depicted in Figure 4, 2 K-type thermocouples (+/−1°C) measure the seal's environment in the upstream chamber and the test rig ambient temperature. Oil leakage through the seals is evaluated thanks to a precision scale (+/−0.001 g) in which leaked oil is redirected. Finally, a torquemeter measures the total friction torque generated by the test cell with a precision of +/−0.005 N.m. For this study, two different data acquisition systems (DAQ) are used: the first one, at low frequency (1 Hz), ensures the temperatures and mass records while the second one (at 2 400 Hz) is used for torque and rotational speed records.
As the torquemeter is directly mounted on the shaft right before the studied seal, one can assumes that the measure during the test corresponds directly to the seal's friction torque. However, due to external effects such as rotor unbalance or deviation with the rotational speed coming from the torquemeter itself, a residual torque can be found without the seal. Then, friction torque induced by the studied seal, Tf, is calculated by subtracting the torque of the test rig without the seal, T0 (including rotor unbalance effect, torquemeter effect, …), from the torque measured during the tests, Ttot. The incertitude about seal's friction torque is a combination of measurements errors (see [1,7]).
 (1)
(1)
The dimensionless torque  , obtained by dividing the measured torque without the seals, T0, by the maximal value of the total measured torque, max(Ttot), is depicts in Figure 7. Error bars indicate twice the standard deviation. This figure shows that the test rig friction torque T0 is one order of magnitude below the total measured torque. This means that seal's friction torque evaluation is consistent as it is much larger than the torque of the test cell only (without the seal).
Finally, the mechanical behavior of the test rig has been evaluated with one seal. As shown by the cascade plot in Figure 8 obtained by FFT applied to the measured total torque for several rotational speed, two dominant components are observed: 0.5X and 1X. Two pics are denoted suggesting high vibrations of the test rig near 7 000 rpm and 14 000 rpm. If those vibrations aren't destructors for the test rig, they will increase the measurement error of the total torque for operating points around these two rotational speeds.
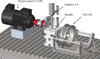 |
Fig. 3 3D CAD view of the mechanical parts of the 30.000 rpm test rig. |
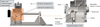 |
Fig. 4 Cross section view of the test cell adapted to the studied seal. |
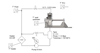 |
Fig. 5 Hydraulic loop associated with the test rig. |
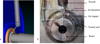 |
Fig. 6 Oil jet dynamic obtained in CFD (a) and experimental (b). |
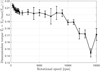 |
Fig. 7 Dimensionless torque induces by the test rig without the seal |

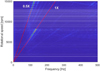 |
Fig. 8 Cascade plot obtained from the measured total torque Ttot. |
3 Experimental results and discussions
In order to evaluate the seal's behavior on the studied rotational speed range, several parameters have been taken into account as described in Table 2. One test consists of varying the rotational speed from 0 rpm to 15 000 rpm by means of speed level for fixed operating parameters listed in this table (example: oil injected on the seal housing at 20 °C at 0.11 l/min with 10 seconds on each rotational speed level). Each test was repeated 3 times to evaluate potential seal and/or rotor wear effect. Finally, the seal is mounted in the test cell and around the rotor at least 24h00 before the first tests.
Figure 9 depicts the effect of the rotational speed and the test time on the friction torque induced by the seal. Results are obtained for injected oil at 20°C at 0.11 l/min with a projection on the rotor surface. Error bars indicate twice the standard deviation (+/−σ). It is firstly observed that the friction torque decreases with rotational speed. For the short test time, the friction torque decreases almost linearly on the studied speed range (1 000 rpm − 15 000 rpm) suggesting that the seal operates in mixed lubricated regime. However, the asymptotic diminution of the friction torque for long test time indicates that the hydrodynamic regime is almost reached at 15 000 rpm. On Figure 9, a slightly higher friction torque is observed for the 1st long try (in blue) compared to others long tries (orange and yellow). This suggests a running-in period which takes place during the short excitation tries and ends during the 1st long try as the tests were conducted as follows: short excitation tries then long excitation tries.
Figure 9 also shows significant difference in seal's behavior in terms of friction torque depending on the test time at each speed: lower values of friction torque are obtained for long periods than for short ones. This phenomenon is due to viscoelastic effect of the seal which has been highlighted by dedicated tests on “radiameter” comparable to stress relaxation test: on this equipment, the seal is mounted around a jig that has a short length shaft and is split in half lengthwise. One half is rigidly fixed on the stator while the second is connected to a force transducer measuring the normal force F induced by seal's deformation over time [8,9] (see Figs. 10 and 11a). The radial total load Wt is then obtained by integration of the radial load Fr.
For the present study, Figure 11 shows evolution of Wt over time applied by the studied seal before dynamic tests (at new state). Two tests have been conducted with the same seal: firstly, the radial total load over time (15 min at fixed strain) is measured with a brand-new seal and the black curve is obtained. Then, the seal is removed from the radiameter for a period of 48 h (during which no strain is applied on the studied seal and the latter is then totally free) before leading a new measurement of Wt over time (15 min at fixed strain) and the blue curve is finally obtained. Error bars indicate the transducer uncertainty. This figure highlights a viscoelastic effect: resulting in stresses decrease over time but not permanently. The radial total load seems to stabilize around 170 N, corresponding to a total contact pressure of about 1 N/mm2 since the length of the contact lip/rotor is estimated around 1.4 mm.
 (2)
(2)
Finally, slight diminution of the friction torque between the 1st long test (in blue) and the two next ones (represented in orange and yellow) is observed on Figure 9, especially at low rotational speed. Those differences are assumed to come from seal and rotor wear during the 1st test. As the estimated friction torque between the 3 tests are almost equal at high speeds (>9 000 rpm), wear is assumed to take place principally at low speeds.
Figure 12 depicts the estimated flowrate during the 3 tests that correspond to the long test time tests plotted in Figure 9. Data from the short time tests are not presented as no leakage has been measured during the runs: time at each rotational speed is not long enough to allow oil recovering. Moreover, a higher friction torque has been observed during those tests (in black on the Fig. 9) suggesting higher contact pressure between the seal and the rotor resulting in low leakage. It is observed on Figure 12 that flowrate presents an exponential evolution with rotational speed which reinforce the effect of the mixed lubrication regime with an increase of the film fluid, especially for high rotational speed where the hydrodynamic regime is almost reached. It must be underlined that a maximum leakage of around 0.24 g/min, which corresponds to approximately 5 drops/min, has been found during the tests (1st try in blue). Depending on the engine architecture in which this kind of seal can be found, this significant oil leakage (5 drops/min) through the seals can lead to system damage due to excessive loss of lubricant. Finally, Figure 12 also shows a hysteresis between the speed up and speed down phases. It is assumed that the source of this disparity lies in the viscoelastic behavior of the studied seal.
The effect of oil temperature on power loss induced by the seal (Pseal = ωTf) is presented in Figure 13. The graph depicts results obtained from tests led with oil injected at 0.11 l/min on the rotor (area 3 in the Tab. 2) and oil temperature of 20 °C (results are presented in shade of gray) and 60 °C (presented in shade of blue). Error bars indicate twice the standard deviation. For those two temperatures, dynamic viscosity of the fluid is respectively around 0.023 and 0.006 Pa.s. Figure 13 shows only slight reduction of the power losses (friction torque) induce by the seal with the oil temperature for long and short test time (around − 7% at 15 000 rpm) despite the great dynamic viscosity diminution. This observation shows that, for the studied operating conditions, injected oil temperature has slight impact on global behavior of the seal.
Impact of the projected area has been studied though 3 different nozzle positions (Tab. 2): on the seal housing (area 1), near the dynamic sealing (area 2) and on the rotor (area 3). Results are presented on Figure 14 which also depicts the effect of inlet oil flowrate on the power losses induced by the tested seal. Error bar represents twice standard deviation. The figure shows that no impact of the inlet oil flowrate on seal's behavior has been measured: power losses are almost equal for flowrate of 0.11 l/min and 0.22 l/min. However, Figure 14 shows a slight diminution of the obtained power losses for area 2 and 3 compared to area 1 suggesting that these oil injection positions seem to improve lubrication at the seal and rotor interface resulting in friction torque decrease. Nevertheless, differences between the studied oil projection areas are at the same order of magnitude than the standard deviation. Thus, further investigations need to be carried out to highlight the impact of oil projection. Additionally, the representativity of the oil jet within the electric motor system must also be improved to ensure more accurate analysis of its effects.
Finally, results obtained during this seal's dedicated experimental campaign are compared to those obtained by [6]. In the latter, authors estimated experimentally the power losses induced by 2 seals mounted in their real environment: an electric motor. The seal's and the lubricant studied in [6] are exactly the same than those studied in the present work on the 30 krpm test rig (see Tab. 1). To allow the comparison between [6] and the present study, it is supposed that the two seals in [6] operate in a strictly identical manner. Then, power losses induce by only one seal is assumed to be half the raw data. Results are presented in Figure 15 with experimental data of [6] presented in orange and compared with the present data in black. Error bars indicate twice the standard deviation. Same tendencies are found between the 2 studies but larger losses are found for the present work (around + 20% at 15 000 rpm). The observed disparities are comparable to the standard deviation of measurements, indicating that the methodology employed in [6] can estimate the order of magnitude and the trends of the power losses caused by seals. Moreover, this comparison highlights that the results obtained in this present study with the 30 krpm test rig are relevant with the seal's behavior in an electric engine [6]. This suggests that obtained results and/or comments can be transposed to other electric engines as long as they remain similar in terms of architecture and operating conditions (rotational speed, diameter, oil viscosity, …).
Studied operating parameters.
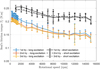 |
Fig. 9 Effect of excitation time on the seal's friction torque Tf, (+/− σ). |
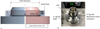 |
Fig. 10 Cross view of the radiameter (a) and view of the assembly (b). |
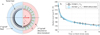 |
Fig. 11 Acting forces on the radiameter (a) and evolution of total radial load Wt for a brand-new seal (b). |
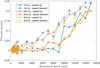 |
Fig. 12 Leakage flow rate during long excitation time tests. |
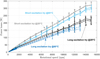 |
Fig. 13 Effect of oil temperature on power losses induce by the seal, (+/− σ). |
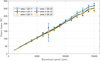 |
Fig. 14 Effect of projected area and oil flowrate on power losses induce by the seal, (+/− σ). |
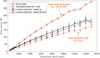 |
Fig. 15 Effect of projected area and oil flowrate on power losses induce by the seal, (+/− σ). |
4 Summary, conclusions and future efforts
The present work first presents the effect of excitation time at fixed rotational speed on PTFE Lip seal behavior. It has been highlighted that viscoelastic comportment of this kind of seal lead to a friction torque decrease while increasing the test time. Then, power losses induced by this seal's technology will decrease if the excitation is long enough. In addition, this parametric study shows that oil temperature, as well as projected area and inlet oil flowrate, has only slight impact on the seal's behavior, especially on the induced friction torque.
This study also highlighted the lubrication regimes where this kind of seal is assumed to work. On the range of studied rotational speed, equivalent to peripheric speed up to 30 m/s, the seal is working in a mixed regime as no inflection of the friction torque, characteristic of the hydrodynamic regime, has been detected.
Future efforts will be oriented in wear qualification by means of observation and measurement of the seal and the rotor before and after tests. The same operating parameters will be studied in the future to complete the present analysis. The effect of static and dynamic eccentricities on the sealing performance of the PTFE lip seal will also be studied.
In addition, reliability study dedicated to this kind of seal will be led to highlight its lifespan.
Nomenclature
F: Normal force measured with the radiometer [N]
Fr: Radial load induced by the seal on the rotor [N]
Pseal: Power loss induced by the seal [W]
T0: Torque of the test rig without the seal [N.m]
 : Dimensionless torque of the test rig without the seal [-]
Tf: Friction torque induced by the seal [N.m]
Ttot: Total torque measured during test [N.m]
Wt: Radial total load induced by the seal on the rotor [N]
ω: Rotational speed [rad/s]
σ: Standard deviation [units]
σ0: Standard deviation associated with the test rig torque (without the seal) [N.m]
σTf: Standard deviation associated with the seal’s friction torque [N.m]
σTtot: Standard deviation associated with the measured torque [N.m]
Acknowledgments
This work has been presented at the 23rd tribo-pprime workshop.
Funding
This research received no external funding.
Conflicts of interest
The authors declare that they have no conflict of interest.
Data availability statement
This paper has no associated data generated.
Author contribution statement
All authors participated in the study and agreed with this version of the manuscript.
Conceptualization, all authors; Methodology, Thomas VALIN, Erwan FOURT, Pierre VIOT; Investigation, Thomas VALIN, Erwan FOURT, Pierre VIOT; Writing − Original Draft Preparation, Erwan FOURT; Writing − Review & Editing, all authors.
References
- A. Carriero, M. Locatelli, K. Ramakrishnan, G. Mastinu, M. Gobbi, A review of the state of the art of electric traction motors cooling techniques, SAE Technical Paper 2018-01–0057, SAE International, Warrendale, PA, 2018 [Google Scholar]
- Y. Gai, M. Kimiabeigi, Y. Chuan Chong, J.D. Widmer, X. Deng, M. Popescu, J. Goss, D.A. Staton, A. Steven, Cooling of automotive traction motors: schemes, examples, and computation methods, IEEE Trans. Ind. Electron. 66, 1681–1692 (2019) [Google Scholar]
- C. Liu, Z. Xu, D. Gerada, J. Li, C. Gerada, Y. C. Chong, M. Popescu, J. Goss, D. Staton, H. Zhang, Experimental investigation on oil spray cooling with hairpin windings, IEEE Trans. Ind. Electron. 67, 7343–7353 (2020) [Google Scholar]
- T. Davin, J. Pellé, S. Harmand, R. Yu, Experimental study of oil cooling systems for electric motors, Appl. Therm. Eng. 75, 1–13 (2015) [Google Scholar]
- R. Sindjui, G. Zito, S. Zhang, Experimental study of systems and oils for direct cooling of electrical machine, J. Therm. Sci. Eng. Appl. 14, ASME International, 2022 [Google Scholar]
- G. Bourhis, R. Sindjui, A. Gilson, G. Zito, Experimental separation of no-load losses of an electric motor with direct oil cooling, in: 2022 International Conference on Electrical Machines (ICEM), 2022 [Google Scholar]
- A.S. Morris, Measurement and Instrumentation, Elsevier, 2016 [Google Scholar]
- H. Muller, Fluid Sealing Technology: Principles and Applications, Routledge & CRC Press, 1998 [Google Scholar]
- A. Azzi, Étde théorique et expérimentale des systèmes d'étanchéité par joints pneumatiques, Thèse, Université de Poitiers, 2019 [Google Scholar]
Cite this article as: Valin Thomas, Fourt Erwan, Viot Pierre, Milosavljevic Misa, Experimental analysis of the leakage characteristics of an oil cooled electric motor L-shaped lip seal in high-speed conditions, 26, 24 (2025), https://doi.org/10.1051/meca/2025016
All Tables
All Figures
|
Fig. 1 General architecture of the electric motor in [6] (a) and representation of the seal environment (b). |
| In the text | |
|
Fig. 2 3D CAD view of the studied seal (a) and section view of a brand-new seal (b). |
| In the text | |
|
Fig. 3 3D CAD view of the mechanical parts of the 30.000 rpm test rig. |
| In the text | |
|
Fig. 4 Cross section view of the test cell adapted to the studied seal. |
| In the text | |
|
Fig. 5 Hydraulic loop associated with the test rig. |
| In the text | |
|
Fig. 6 Oil jet dynamic obtained in CFD (a) and experimental (b). |
| In the text | |
|
Fig. 7 Dimensionless torque induces by the test rig without the seal |
| In the text | |
|
Fig. 8 Cascade plot obtained from the measured total torque Ttot. |
| In the text | |
|
Fig. 9 Effect of excitation time on the seal's friction torque Tf, (+/− σ). |
| In the text | |
|
Fig. 10 Cross view of the radiameter (a) and view of the assembly (b). |
| In the text | |
|
Fig. 11 Acting forces on the radiameter (a) and evolution of total radial load Wt for a brand-new seal (b). |
| In the text | |
|
Fig. 12 Leakage flow rate during long excitation time tests. |
| In the text | |
|
Fig. 13 Effect of oil temperature on power losses induce by the seal, (+/− σ). |
| In the text | |
|
Fig. 14 Effect of projected area and oil flowrate on power losses induce by the seal, (+/− σ). |
| In the text | |
|
Fig. 15 Effect of projected area and oil flowrate on power losses induce by the seal, (+/− σ). |
| In the text | |
Current usage metrics show cumulative count of Article Views (full-text article views including HTML views, PDF and ePub downloads, according to the available data) and Abstracts Views on Vision4Press platform.
Data correspond to usage on the plateform after 2015. The current usage metrics is available 48-96 hours after online publication and is updated daily on week days.
Initial download of the metrics may take a while.