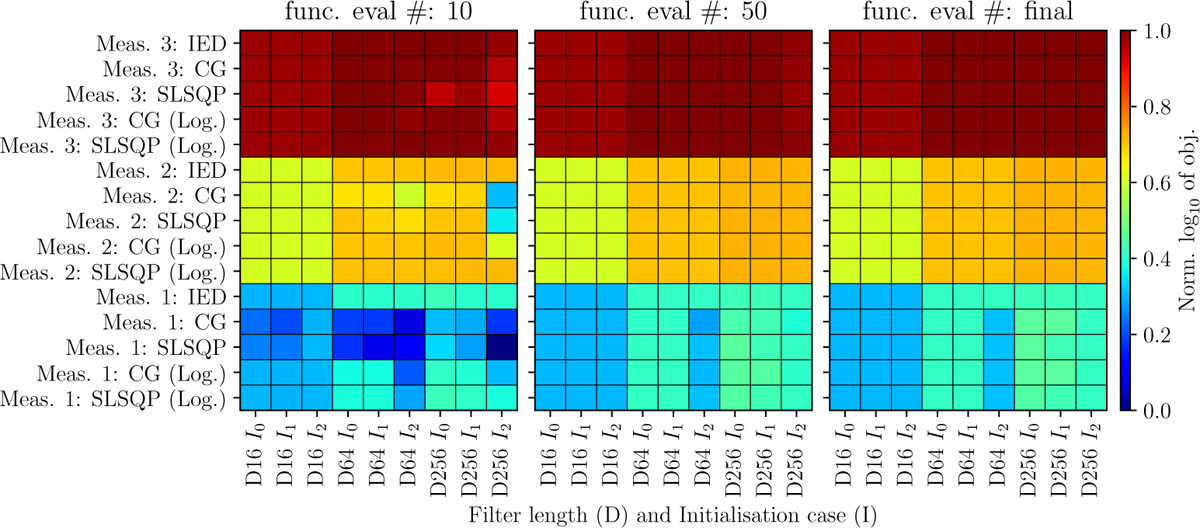
Fig. A.1
Download original image
The normalised logarithm of the final ICS2 objective for the three simulated measurements is shown for different hyperparameters. Different combinations of optimisation problem formulations and algorithms are shown on the ordinate, and the filter length D and filter starting points I0, I1 and I2 are shown on the abscissa. Three stages are presented: The objective after 10 function evaluations (left), the objective after 50 function evaluations (middle) and the final objective’s value (right). For example, if the optimiser terminated before 50 function evaluations, the converged solution is presented in the middle plot.
Current usage metrics show cumulative count of Article Views (full-text article views including HTML views, PDF and ePub downloads, according to the available data) and Abstracts Views on Vision4Press platform.
Data correspond to usage on the plateform after 2015. The current usage metrics is available 48-96 hours after online publication and is updated daily on week days.
Initial download of the metrics may take a while.