Fig. 2
Download original image
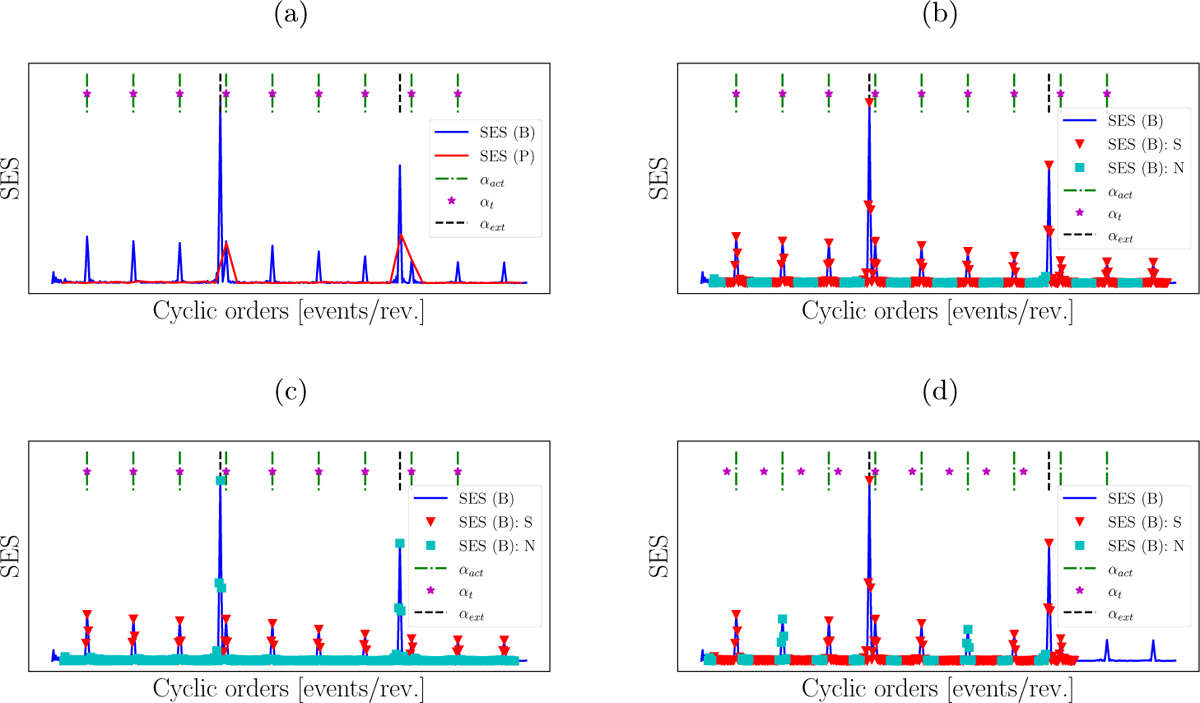
Foundational SES examples are presented with the actual cyclic order αact, the targeted cyclic order αt, and the extraneous cyclic order αext superimposed. (a) compares a baseline SES (SES (B)) against an SES where the CORF is increased (SES (P)). (b) shows the baseline SES with the amplitudes contributing to the signal (SES (B): S) and noise (SES (B): N) indicators. (c) shows the same plot as (b), but the targeted band’s width is decreased. (d) shows the same plot as (b), but an error is introduced in the targeted cyclic order as follows: αt = αc · (1 - error), where the error = 0.2.
Current usage metrics show cumulative count of Article Views (full-text article views including HTML views, PDF and ePub downloads, according to the available data) and Abstracts Views on Vision4Press platform.
Data correspond to usage on the plateform after 2015. The current usage metrics is available 48-96 hours after online publication and is updated daily on week days.
Initial download of the metrics may take a while.