Fig. 4
Download original image
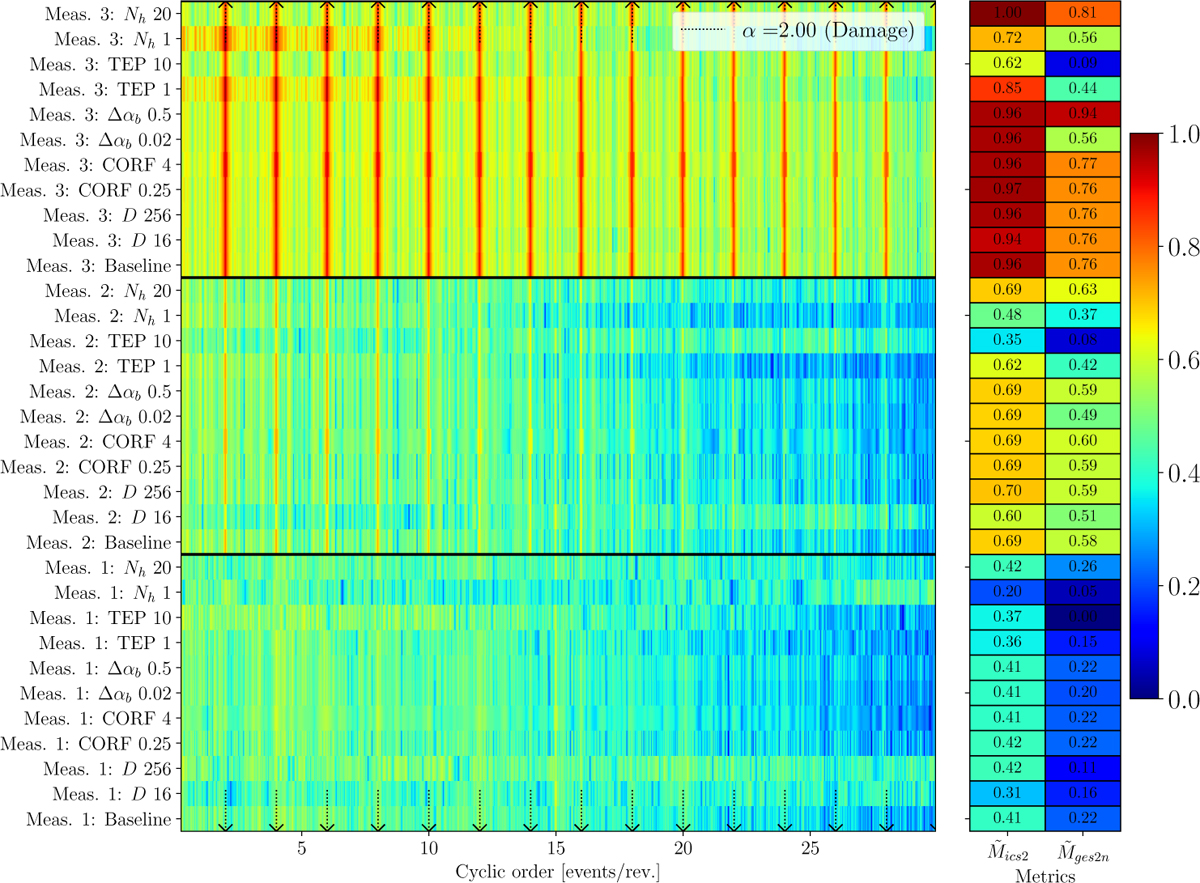
The logarithm of the SES of the filtered signal and the corresponding normalised metrics are presented for three simulated measurements. The filters were obtained by maximising the ICS2 objective. The measurement number and the baseline or perturbation from the baseline are shown on the ordinate. The logarithm of the SES data are normalised between 0 and 1 and the metrics are normalised between 0 and 1 using the ICS2 and GES2N’s data to enable uniformity in colour presentation.
Current usage metrics show cumulative count of Article Views (full-text article views including HTML views, PDF and ePub downloads, according to the available data) and Abstracts Views on Vision4Press platform.
Data correspond to usage on the plateform after 2015. The current usage metrics is available 48-96 hours after online publication and is updated daily on week days.
Initial download of the metrics may take a while.