| Issue |
Mechanics & Industry
Volume 26, 2025
Robotic Process Automation for Smarter Devices in Manufacturing
|
|
|---|---|---|
| Article Number | 19 | |
| Number of page(s) | 8 | |
| DOI | https://doi.org/10.1051/meca/2025009 | |
| Published online | 27 May 2025 | |
Original Article
Perspective projection measurement method for rolling vibration test bench of locomotives and vehicles
Sichuan Vocational and Technical College of Communications, Chengdu, PR China
* e-mail: This email address is being protected from spambots. You need JavaScript enabled to view it.
Received:
20
December
2024
Accepted:
3
March
2025
Abstract
With the rapid development of railway transportation, using a locomotive and vehicle rolling vibration test bench for dynamic simulation testing is one of the extremely important testing methods in the current locomotive and vehicle development process. The rolling vibration table simulates the dynamic changes of the actual track by applying excitation to a finite radius track wheel. The measurement error of the spatial geometric parameters of the track wheel has an undeniable impact on the bench test. This paper proposes a method for measuring the geometric parameters of a rolling vibration test bench for locomotives and vehicles. Using the perspective projection theory, a geometric parameter measurement model for the rolling vibration test bench is established, and a measurement system calculation program is developed to achieve high-precision measurement of the static geometric parameters of the rolling vibration test bench for locomotives and vehicles.
Key words: Rolling vibration test bench for locomotives and vehicles / track wheel / perspective projection theory
© Q. Zhang and B. Chen, Published by EDP Sciences 2025
 This is an Open Access article distributed under the terms of the Creative Commons Attribution License (https://creativecommons.org/licenses/by/4.0), which permits unrestricted use, distribution, and reproduction in any medium, provided the original work is properly cited.
1 Introduction
The rolling vibration test bench for locomotives and vehicles tests the dynamic response of locomotives and vehicles by exciting the track wheels through a hydraulic system. The use of a rolling vibration test bench for dynamic simulation testing can efficiently complete the optimisation design of locomotives and vehicles and is one of the most important testing methods in the current locomotive and vehicle development process [1,2].
The purpose of the rolling vibration test bench is to simulate the vertical, lateral, and track irregularities of the actual track, as well as the dynamic changes in track gauge, by inputting the dynamic response of the track wheels [3]. Therefore, in order to ensure the accuracy and reliability of bench test data and minimise test errors, the primary task during the test preparation period is to determine the spatial static geometric parameters of the track wheels of the test bench. The measurement method and accuracy are particularly important.
The measurement of the rolling vibration table is defined as large-scale three-dimensional measurement in the field of surveying and mapping science, also known as industrial measurement [4]. The latitude and longitude industrial measurement system is one of the cheapest and most accurate measurement systems [5]. This system can establish a fixed measurement working point for the rolling vibration test bench, and calibrate the spatial state parameters of the track wheels before and after each test to determine the actual initial state of the test bench, providing raw parameters for each bench simulation test for comparison and traceability.
The measurement of the rolling vibration table parameters for locomotives and vehicles, from the early wire-based measurement method to the currently used optical instrument “aiming point measurement method”, all have millimeter level measurement accuracy. The requirement for a 0.5 mm error in the rolling vibration table is obviously insufficient in terms of measurement accuracy. However, there is currently limited research on the measurement methods of spatial parameters for rolling vibration test benches. In 1995, Cen Minyi, Liu Chenglong, and others[3] proposed a precise measurement method for the rolling vibration test bench of locomotives and vehicles. This method is relatively complex and requires instrument investment.
The main purpose of the rolling vibration table measurement system is to measure the spatial position of the 8 track wheels of the rolling vibration table to determine the initial state parameters before the test drive. The measurement of geometric parameters of the rolling vibration table is essentially the determination of the spatial state of the track wheel. The track wheel is an important component for simulating actual steel rails on a rolling vibration table. During the testing process, the track wheel is tangent to the corresponding wheel of the test vehicle, forming a “wheel- wheel” contact relationship. In actual measurement, there may be errors in the spatial position measurement of the track wheel in five degrees of freedom [6], as shown in Figure 1. The five measurement errors of the track wheel will inevitably affect the calculation of the contact geometry parameters [7], so it is necessary to analyze the specific impact of the five measurement errors on the contact geometry parameters.
Currently, the methods for solving the contact relationship of arbitrary geometric surfaces [9,10] include the trial-and-error approach and the trace method. Both numerical methods can be applied to wheel-rail and wheel-wheel relationships. The wheel-wheel contact relationship is more complex than the wheel-rail contact relationship, resulting in longer numerical solution times. However, the "trace method" is computationally faster compared to the trial-and-error approach. Therefore, this paper adopts the trace method to solve the wheel-wheel contact geometry relationship. This paper will use the trace method to calculate the influence of five measurement errors on the contact geometry parameters. Through derivation, the coordinates of the contact point in the track wheel coordinate system are obtained as (x, y, z). Thus, we have:
 (1)
(1)
 (2)
(2)
 (3)
(3)
 (4)
(4)
 (5)
(5)
 (6)
(6)
The unknowns involved in the equation derivation up to this point are: x, y, z, εL, rL, rrL, lL, δL, θ, φ, yG, zG. Before calculation, the yaw angle φ, wheelset lateral displacement yG, and wheelset lift zG need to be predetermined. Special attention should be paid to the value of, which must be sufficiently large to ensure that the wheel and the track wheel do not embed into each other.
Through calculations and derivations under different working conditions, the five measurement errors have a non-negligible impact on the contact point position, wheel rolling circle diameter difference, contact angle difference, equivalent conicity, and the lead/lag angle of the track wheel.
Therefore, if the initial state of the rolling vibration test bench cannot be accurately determined, the accuracy of the data obtained from the simulated tests of the vehicle under test cannot be guaranteed, which severely impacts the results of the locomotive and vehicle simulation tests. The rolling vibration test bench is a large-scale testing device, characterised by its large size, difficulty in movement, frequent changes in the position of the track wheels, and challenges in operating the measurement site. These factors make contact-based measurements not only time-consuming and labor-intensive but also unable to achieve a high level of automation. In contrast, non-contact measurement methods can meet the requirements for measurement accuracy while also improving measurement efficiency. Among non-contact measurement systems, the theodolite industrial measurement system is one of the earliest developed and most precise systems. It offers flexible setup and relatively low manufacturing costs, making it highly suitable for measuring the rolling vibration test bench. Therefore, this paper leverages theodolite industrial measurement system technology to develop a practical and feasible measurement system for the rolling vibration test bench.
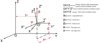 |
Fig. 1 Five measurement errors of the track wheel. |
2 Rolling vibration table measurement system model
With the development of photogrammetry, scholars have proposed the method of using perspective projection to establish a three-coordinate measurement system for theodolites [10]. This method can simplify the constraints in the mutual sighting model and obtain the coordinate values of spatial points in the system coordinate system by nonlinear optimisation of the spatial image point coordinates of two angle measuring instruments.
The perspective projection model of the rolling vibration table is a three-dimensional spatial model composed of two angle measuring instruments. Two angle measuring instruments require the establishment of two projections, as shown in Figure 2.
As shown in Figure 2, let the coordinate system of the left angle measuring instrument be consistent with the overall coordinate system Oxyz of the rolling table measurement system, and the coordinate system of the right-angle measuring instrument be O2 × 2y2z2. Let's assume that the distance between the observation centers of two angle measuring instruments and their respective projection planes is 1, with the left projection plane coordinate system being O'1x'1y'1and the right projection coordinate system being O'2x'2y'2.
Let the projection points of the spatial point Pwi on the projection planes of the left and right-angle measuring instruments be P1i and P2i, respectively. The homogeneous coordinate vector of Pwi under Oxyz is  , and the homogeneous coordinate vector under O2 × 2y2z2 is
  . The homogeneous coordinate vector of P1i in the O'1x'1y'1 coordinate system is
  , and the homogeneous coordinate vector of P2i in O'2x'2y'2 is
  . According to the perspective projection model of the rolling vibration table, the following results are obtained:
 (7)
(7)
The Euclidean transformation (Rigid transformations that maintain the shape and size of an object, mainly including translation, rotation, and reflection operations) between the left angle measuring instrument coordinate system Oxyz and the right-angle measuring instrument coordinate system O2 × 2y2z2 can be expressed as:
 (8)
(8)
In the formula, R represents the relative direction between the coordinate systems of two angle measuring instruments.

t—translation vector between the origin points of two angle measuring instruments in the coordinate system

According to equations (7) and (8), the relationship between the spatial point Pwi and the projections P1i and P2i from the two angle measuring instruments is as follows:
 (9)
(9)
 (10)
(10)
P1—3 × 4 left angle measuring instrument projection matrix in the formula.
P2—3 × 4 right angle measuring instrument projection matrix.
I —3 × 3 identity matrix.
From the above analysis, it can be concluded that the projection plane coordinates can be obtained based on the observation angles of the two angle measuring instruments, and then the three-dimensional coordinates of the spatial points can be obtained by calculating the matrix P2. From the stereo vision system, it can be known that the problem of solving matrix P2 can be transformed into the problem of solving the essential matrix E —The core tool for describing camera geometric relationships in stereoscopic vision), Next, the normalised eight-point algorithm proposed by R.H. Hartley is used to solve the essential matrix. Then, by performing singular value decomposition (SVD) on the essential matrix, the rotation matrix R and the translation vector t are obtained. With these, the three-dimensional coordinates of point P in the system coordinate frame can be calculated.
The perspective projection model of the rolling vibration table adopts the perspective projection theory, which projects the measured point onto a virtual image plane and then solves the rotation matrix and translation vector between the two instruments through matrix decomposition and nonlinear optimisation methods, and finally obtains the three-dimensional coordinate values of the measured point. The previous text provided the calculation formula for using the perspective projection model to solve spatial points. It can be seen that the factors that affect the calculation results include the accuracy of the angle-measuring instrument, the accuracy of the image point coordinate values, and the accuracy of the solution of the normal equation. Usually, when solving algorithm equations, if the coefficient matrix is a singular or poorly conditioned matrix, the solution results may be unsolvable or have significant errors. Therefore, as long as the coefficient matrix of the normal equation is avoided from being ill conditioned or singular as much as possible, the measurement accuracy can be guaranteed. In actual observation, the target points and benchmark markers should be avoided from being distributed at the same height or within the same plumb plane as much as possible.
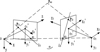 |
Fig. 2 Perspective projection of rolling vibration table. |
3 Results and discussion
3.1 Measurement steps of the rolling vibration table
The rolling vibration table measurement system can use mutual aiming calculation model and perspective projection calculation model. The equipment and instruments used in the two calculation models are the same, but the measurement steps differ. After the analysis in the previous section, the optimal measurement scheme for the rolling vibration table has been determined. The layout of the rolling vibration table measurement system is shown in Figure 3, with point A1 as the coordinate origin, and the measurement system coordinate system is established as shown in Figure 3.
The measurement process flowchart using the perspective projection model is presented in Figure 4.
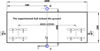 |
Fig. 3 Layout of the rolling vibration table measurement system and establishment of system coordinate framework. |
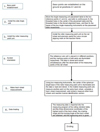 |
Fig. 4 Flowchart of measurement steps for the rolling vibration table. |
3.2 Geometric parameter measurement program for rolling vibration table
A data processing program interface for the calculation model was developed using the GUI module MATLAB to support the measurement model in completing the measurements. The geometric parameter perspective projection model calculation program of the rolling vibration table is developed based on the perspective projection model calculation method, and also contains two interfaces: system orientation and object point determination. The two interfaces are shown in Figure 5 and Figure 6.
The system orientation of the perspective projection model algorithm requires at least eight different spatial target point observation angles as inputs, including the vertical mean square error of the instrument mv, the length D, of the reference ruler, and the length error of the reference ruler md. By calculation, the rotation matrix and translation vector between two angle measuring instruments can be solved.
After system orientation is completed, the measurement of the target point of the track wheel can be carried out. The parameters that need to be input include: the observation angle of two measuring points on the same track wheel; the mean square error of the angle −measuring instrument in measuring horizontal and vertical angles, the data value measured on the previous interface, and the angle measured by the tilt sensor. Through calculation, the three-dimensional coordinates of the highest point of the track wheel, as well as the yaw and flip angles of the track wheel, can be obtained.
Simulate and calculate according to the point positions shown in Figure 3. Compare the simulated coordinates with the calculated coordinates, as shown in Table 1.
Note: As the flipping angle φ is directly measured by the tilt sensor, its error is 0.005°, which corresponds to the angular accuracy of the tilt sensor.
From the table, it can be seen that the composite error of the track wheel parameters solved using the perspective projection algorithm does not exceed ± 0.41 mm, and the heading angle error does not exceed ± 0.07.
 |
Fig. 5 System orientation interface of perspective projection method. |
 |
Fig. 6 Object point measurement interface of perspective projection method. |
Properties of raw materials.
4 Conclusion
The measurement method proposed in this article can accurately measure the geometric parameters of the rolling vibration test bench for locomotives and vehicles. For the wheel-wheel contact geometric parameters, the measurement error of the rolling vibration table geometric parameters will have varying degrees of impact on the contact point position, wheel rolling circle diameter difference, contact angle difference, equivalent taper, and track wheel lead-lag angle. The development of an efficient and accurate rolling vibration table measurement system is necessary. Using the “perspective projection theory” to establish a mathematical model for measuring the geometric parameters of the rolling table, and using simulation calculation programs to achieve computer processing of the measurement data, it is possible to achieve an error of less than 0.41 mm in the three-dimensional coordinate values of the highest point of each track wheel and the coordinate values of the center point of the reaction frame, an error of less than 0.005° in the flipping angle of each track wheel, and an error of less than 0.07° in the shaking angle of each track wheel, achieving the purpose of this study.
Acknowledgments
Not applicable.
Funding
The author acknowledges Sichuan Province Mountain Rail Transit Equipment Industry Education Integration Demonstration Project, China University Research Innovation Fund (Grant: 2023KY061), Sichuan Provincial Department of Education Project (GZJG2022-493), China University Research Innovation Fund (Grant: 2022BC132).
Conflicts of interest
The author(s) declared no potential conflicts of interest with respect to the research, author-ship, and/or publication of this article.
Data availability statement
The datasets used and/or analyzed during the current study are available from the corresponding author on reasonable request.
Author contribution statement
Conceptualization, Qing Zhang; methodology, Biao Chen; software, Qing Zhang; validation, Biao Chen; formal analysis, Qing Zhang; investigation, Biao Chen; resources, Qing Zhang; data curation, Biao Chen; writing—original draft, Qing Zhang; writing—review and editing, Biao Chen; visualization, Qing Zhang; supervision, Biao Chen; project administration, Qing Zhang; funding acquisition, Qing Zhang and Biao Chen. All authors have read and approved the final version of the manuscript.
References
- S.W. Lee, S. Sarp, D.J. Jeon and J.H. Kim. Smart water grid: the future water management platform, Desal. Water Treat. 55, 339–346 (2015) [CrossRef] [Google Scholar]
- L. Huang, W. Zhang, Q. Ma, Design of rolling vibration test bench for locomotive and rolling stock, Railway Vehicles, 5–8 +16+45 (2007) [Google Scholar]
- G. Huang, Theory, Methods, and Applications of Digital Close-up Industrial Photogrammetry, Science Press, Beijing, 2016 [Google Scholar]
- N. Geng, Research and system implementation of theodolite coordinate measurement orientation method, MSc thesis, Tianjin University, 2010. [Google Scholar]
- W. Zhang, Calculation method for contact points of spatial state wheels (rails), China Railway Science 27, 76–79 (2006) [Google Scholar]
- J. Zhang, Research on the geometric relationship of wheel-rail and wheel-wheel contact and surface measurement, PhD thesis, Southwest Jiaotong University, 1998 [Google Scholar]
- J. Yan, Research on geometric constraints of wheel-rail space with arbitrary contour shapes, J. Southwest Jiaotong Univ., 43–51 (1983) [Google Scholar]
- K. Wang, Calculation of wheel contact point trace and wheel-rail contact geometric parameters, J. Southwest Jiaotong Univ., 92–102 (1984) [Google Scholar]
- F. Zhou, G. Zhang, J. Jiang, B. Wu, S. Ye, On-site dual theodolite 3D coordinate measurement system, J. Mech. Eng., 165–169 (2004) [CrossRef] [Google Scholar]
- Z. Zhang, J. Gu, N. Geng, H. Zhou, S. Ye, Design of dual theodolites 3D coordinate measurement system, J. Sensing Technol., 660–664 (2010) [Google Scholar]
- S. Yi, Research on several issues in stereoscopic matching, PhD thesis, National University of Defense Science and Technology, 2006 [Google Scholar]
Cite this article as: Qing Zhang, Biao Chen, Perspective projection measurement method for rolling vibration test bench of locomotives and vehicles, Mechanics & Industry 26, 19 (2025), https://doi.org/10.1051/meca/2025009
All Tables
All Figures
|
Fig. 1 Five measurement errors of the track wheel. |
| In the text | |
|
Fig. 2 Perspective projection of rolling vibration table. |
| In the text | |
|
Fig. 3 Layout of the rolling vibration table measurement system and establishment of system coordinate framework. |
| In the text | |
|
Fig. 4 Flowchart of measurement steps for the rolling vibration table. |
| In the text | |
|
Fig. 5 System orientation interface of perspective projection method. |
| In the text | |
|
Fig. 6 Object point measurement interface of perspective projection method. |
| In the text | |
Current usage metrics show cumulative count of Article Views (full-text article views including HTML views, PDF and ePub downloads, according to the available data) and Abstracts Views on Vision4Press platform.
Data correspond to usage on the plateform after 2015. The current usage metrics is available 48-96 hours after online publication and is updated daily on week days.
Initial download of the metrics may take a while.