| Issue |
Mechanics & Industry
Volume 20, Number 1, 2019
|
|
|---|---|---|
| Article Number | 109 | |
| Number of page(s) | 15 | |
| DOI | https://doi.org/10.1051/meca/2018052 | |
| Published online | 04 April 2019 | |
Regular Article
Comparison on various machinability aspects between mixed and reinforced ceramics when machining hardened steels
1
Mechanics and Structures Laboratory (LMS), 8 May University of Guelma, BP. 401, 24000 Guelma, Algeria
2
National High School of Technology (ENST), Dergana, Algiers, Algeria
3
Department of Mechanical Engineering, Faculty of Technology Sciences, University of Mentouri Brothers Constantine, P.O. Box 325, Ain-El-Bey Way, Constantine 25017, Algeria
4
Advanced Technologies in Mechanical Production Research Laboratory (LRTAPM), Badji Mokhtar University of Annaba, Annaba, Algeria
* e-mail: This email address is being protected from spambots. You need JavaScript enabled to view it.
Received:
8
March
2015
Accepted:
28
December
2018
Abstract
The hard turning process has an attracting interest in different industrial sectors for finishing operations of hard materials. However, it still presents disadvantages with respect to process capability and reliability. This paper describes a comparison of surface roughness, specific cutting force and flank wear between mixed ceramic CC650 (Al2O3 (70%) + TiC (30%)) and reinforced ceramic CC670 (Al2O3 (75%) + SiC (25%)) cutting tools when machining in dry hard turning of AISI 4140, treated at 52 HRC using the response surface methodology (RSM). A mathematical prediction model of the machining responses has been developed in terms of cutting speed, feed rate and cutting time parameters. Experimental observations show that the surface roughness obtained with the mixed ceramic insert significantly improved when compared with reinforced ceramic insert with a ratio of 1.44. In the same way, insert CC650 has better performance compared to reinforced ceramic inserts CC670, in terms of the specific cutting force and flank wear.
Key words: Hard turning / AISI 4140 steel / ceramic / cutting parameters / ANOVA / RSM
© AFM, EDP Sciences 2019
1 Introduction
The response surface methodology (RSM) is a family of statistical techniques for the design, empirical modeling and optimization of processes where the responses of interest are influenced by several process variables (termed factors). RSM comprises the following three major components: (i) experimental design to determine the process factors' values based on how the experiments are conducted and data are collected; (ii) empirical modeling to approximate the relationship (i.e. the response surface) between responses and factors; (iii) optimization to find the best response value based on the empirical model. These models can be used in optimization, simulation or prediction of turning process behavior, mainly within the experimental range [1–5].
Many researchers have applied the RSM to investigate the effect of cutting parameters on output responses in hard turning. For example, Jenn-Tsong et al. [6] developed RSM model using CCD in the hard turning using uncoated Al2O3/TiC-mixed ceramic tools for flank wear and surface roughness. Flank wear was influenced principally by the cutting speed and the interaction effect of feed rate with nose radius of tool. The cutting speed and the tool corner radius affected surface roughness significantly. Besides, Benga and Abrão [7] have studied tool life and the surface finishing of hardened 100Cr6 bearing steel obtained with PCBN and ceramic inserts using RSM. Dureja et al. [8] applied the RSM to investigate the effect of cutting parameters on flank wear and surface roughness in hard turning of AISI H11 steel with a coated-mixed ceramic tool. The study indicated that the flank wear is influenced principally by feed rate, depth of cut and workpiece hardness. Neseli et al. [9] applied RSM to optimize the effect of tool geometry parameters on surface roughness in hard turning of AISI 1040 with P25 tool. Moreover, Elbah et al. [10] applied RSM and analysis of variance (ANOVA) to investigate the machinability of hardened AISI 4140 cold work tool steel using a range of cutting tools. The results indicated that surface roughness of 4140 steel was improved as cutting speed was elevated and deteriorated with feed rate. However, the surface quality obtained with the wiper ceramic insert allowed a surface finish as good when compared with conventional ceramic insert with a ratio of 2.5. Lalwani et al. [11] studied the effect of cutting parameters in turning on cutting forces and surface roughness. To this end, a number of experiments based on RSM have been carried out and linear and quadratic models have been formed to explain the relation between the parameters. Recently, Aouici et al. [12] applied RSM and ANOVA to investigate the machinability of hardened AISI 4140 cold work tool steel using a range of ceramic cutting tools. From the parametric analysis, it is revealed that the uncoated ceramics (CC650WG wiper and CC650 conventional) perform better than the coated ceramics (CC6050WH wiper and CC650 conventional) with reference to machining forces. On the contrary, wiper ceramic cutting tools (CC6050WH and CC650WG) have better performance compared with conventional ceramic cutting tools (CC6050 and CC650), in particular for the flank wear. In another study, Aouici et al. [13] investigated the effects of cutting speed, feed rate, workpiece hardness and depth of cut on surface roughness, and cutting force components in hard turning AISI H11 steel, hardened to 40, 45 and 50 HRC, respectively, machined using cubic boron nitride tools. Mathematical models were developed for surface roughness and cutting force components using the RSM. Results showed that the cutting force components were influenced principally by depth of cut and workpiece hardness; however, both feed rate and workpiece hardness had statistical significance on surface roughness.
The aim of the study is to evaluate and compare the performance of the two ceramic cutting tools, namely, mixed ceramic CC650 and reinforced ceramic CC670 tools for hard turning of AISI 4140. The ANOVA study involves the effects of cutting parameters (cutting speed and feed rate) coupled with cutting time. The following aspects of the process are addressed: the machining variables of surface roughness, specific cutting force and flank wear.
2 Experimental procedure
Turning experiments were performed in dry conditions using an universal lathe-type SN 40C with 6.6 kW spindle power. The workpiece material AISI 4140 steel with an initial grain size of about 120 μm was used as sample for hot compression; torsion test and ability for possible polishing to answer the most severe requests in spindles, logging parts and pump shafts. Its chemical composition (in wt.%) is given as follows: C 0.43; Cr 1.10; Mo 0.19; V 0.005; Si 0.24; Mn 0.79; S 0.024; Ni 0.022; Fe 96.315 and other components 0.884. Type inserts ceramic tools reference CC650 (mixed ceramic), SNGA120408T01020, reference CC670 (reinforced ceramic) and SNGN120408T01020 were used to machine the AISI 4140 steel with geometry as follows: rake angle −6°, 6° clearance angle and 75° approach edge as shown in Figure 1.
The flank wear (VB) is measured using a HUND optical microscope (W-AD) equipped with CCD camera. Instantaneous roughness criteria measurements (Ra), for each cutting condition, are obtained by means of a Mitutoyo Surftest 201 roughness meter. The length examined is 2.4 mm with a basic span of 3. The measured values of Ra are within the range of 0.05–40 μm. Absolute roughness is directly measured on the same turned part, without disassembling, in order to reduce uncertainties due to resumption operations. The measurements are repeated three times at three reference lines equally positioned at 120° and the result is an average of these values for a given machining pass (Fig. 1).
The setup used to measure the three components of the cutting force − feed force (Fa) − thrust force (Fr) and tangential force (Ft) − is schematically shown in Figure 1. The tool holder is mounted on a three-component piezoelectric dynamometer (Kistler 9257B). The measurement chain also included a charge amplifier (Kistler 5019B130), data acquisition hardware (A = D 2855A3) and graphical programming environment (DynoWare 2825A1-1) for data analysis and visualization. The whole measurement chain has been statically and dynamically calibrated. The static calibration of the dynamometer was made in each force direction. The outputs are voltage signals that are averaged for each direction. The loads up to 3000 N by 25 N intervals were applied, and the deflection values were recorded for each load interval. Thus, calibration curves were obtained to convert the output readings into cutting force values. In order to verify the consistency, the measurements were repeated three times. The effect of loading in a given dynamometer direction on the other force components was also examined and minor fluctuations were found. These effects were small enough to be ignored. The cross-sensitivity was estimated in the range of 0.14–0.81%. For the dynamic calibration, it can be said that natural frequencies of the dynamometer in the three directions are approximately 3 kHz. The recorded forces are not influenced by the dynamic response of the dynamometer because these natural frequencies are higher than the frequency of exciting vibration. So, this dynamometer can be considered as a reliable device for the measurement of cutting forces. In this paper, we used the following conditions to measure the cutting forces: sampling frequency is 100 Hz, time of acquisition is 3 min and the Gaussian filter is 0.8 mm.
Since there are a large number of variables controlling the cutting process, some mathematical models are required to represent this process. However, these models have to be developed using only the significant parameters influencing the process rather than including all the parameters. Two levels were defined for each cutting variable, as given in Table 1. The variable levels were chosen within the intervals recommended by the cutting tool manufacturer. Three cutting variables (cutting speed, feed rate and cutting time or machining time) at two levels led to a total of eight tests. The factors to be studied and the attribution of the respective levels are indicated in Table 2. The combined effects of the process parameters on performance characteristics are investigated while employing the ANOVA. The relationship between process parameters and performance characteristics through the RSM is modeled. The composite desirability optimization technique associated with the multiple linear models of RSM is used as multi-objective optimization approach to find optimum values of process parameters that optimize simultaneously the performance characteristics.
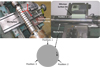 |
Fig. 1 Illustration of cutting tool geometry and experimental configuration for measuring surface roughness criteria [14]. |
Cutting parameters and their levels for turning.
Experimental results for response factors (Ra, Ks and VB).
3 Results and discussion
The AISI 4140 steel hard turning experiments with mixed and reinforced Al2O3 ceramic inserts were carried out by way of a previously defined experimental procedure. More than 16 turning operations were conducted with the aim of evaluating the cutting process (surface roughness, specific cutting force and flank wear). A data variance analysis of surface roughness (arithmetic mean roughness Ra), specific cutting force Ks and tool wear (flank wear VB) was carried out. The main purpose was to analyze the influence of the cutting speed Vc , the feed rate f, depth of cut and the cutting time t on the total variance of the results.
3.1 Surface roughness
The first part of the comparison consists of a study of the workpiece roughness. The objective is to express the roughness, which is a criterion for surface quality, in terms of machining parameters (cutting speed, feed rate and depth of cut) during production control.
Figure 2a shows the effect of cutting speed on surface roughness (Ra) at constant feed rate of 0.08 mm/rev and depth of cut of 0.25 mm. As it can be seen from this figure, the surface roughness (Ra) tends to decrease, considerably with increase in cutting speed (Vc ). This figure also displays that the surface roughness is characterized by two distinct zones according to the cutting speed evolution for CC650 and CC670 tools.
The first zone where the cutting speed varies from 60 to 180 m/min corresponds to a decrease in roughness for both ceramic tools. This surface state improvement is due to high cutting speeds characterized by the absence of built-up edge. Similar results were reported by Bouchelaghem et al. [15] during hard turning of AISI D3 steel with CBN tool. In the present investigation, the effect of cutting speed on surface roughness is as follows: the increase in the cutting speed from 60 to 180 m/min, decreases the surface roughness (RaCC650 and RaCC670) to 35.71 and 29.54%, respectively.
The second zone when the cutting speed is between 180 and 320 m/min, surface roughness is stabilized slightly because of the reduction in cutting forces stabilizing the machining system [16]. In the high cutting speed (second zone), the CC650 tool produces a better surface finish than CC670, which expresses the mixed ceramic (CC650) into the most powerful tool in terms of wear resistance and lifespan (Fig. 5).
Figure 2b presents the effect of feed rate on surface roughness (Ra) at constant cutting speed Vc = 120 m/min and depth of cut ap = 0.25 mm for both ceramic tools CC650 and CC670. It is observed from this figure that the surface roughness increases with increased feed rates, because its increase generates helicoids furrows as a result of tool shape and helicoids movement tool–workpiece. These furrows are deeper and broader as the feed rate increases [17]. For this reason, a weak feed rate has to be employed during turning operation. Similar results were reported by Khelaf et al. [18] when turning AISI H11 steel (50 HRC) using ceramic cutting tools. The insert CC650 provides lower values than the CC670 ceramic tool, which expresses the mixed ceramic (CC650) into the most powerful tool in terms of wear resistance and lifespan (Fig. 5). In general, the CC650 tool produces a better surface finish than CC670.
Figure 2c illustrates the influence of depth of cut on surface roughness (Ra) at constant cutting speed of Vc = 120 m/min and feed rate of f = 0.08 mm/rev for both ceramic tools CC650 and CC670. The effect of the depth of cut on the roughness is very slight. This is due to the increased length of contact between the tool and the workpiece, which in turn improves the conditions of heat flow from the cutting zone and consequently slows down the process wear [16]. This work leads to the recommendation that it is always preferable to increase the depth of cut instead of the feed rate when attempting to increase the chip output while maintaining almost the same value of roughness. Finally, it is well proven that the feed rate drastically influences surface roughness.
The representative examples of 3D images of hard-turned surfaces are visualized by four isometric views, and contour maps are shown in Figure 3. It must be noted that both the 3D profiles have represented pure roughness values, i.e. the turned surface topography in Figures 3a and 3b shows well-defined peaks and valleys. This is mainly because when the turning operation process uses a single cutting edge, it generates helicoids furrows as a result of tool shape and helicoids movement tool-workpiece.
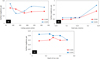 |
Fig. 2 Surface roughness (Ra) evolution as a function of cutting conditions. (a) Cutting speed effect on Ra at f = 0.08 mm/rev; ap = 0.25 mm. (b) Feed rate effect on Ra at Vc = 120 m/min; ap = 0.25 mm. (c) Depth of cut effect on Ra at Vc = 120 m/min; f = 0.08 mm/rev. |
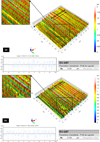 |
Fig. 3 (a) 3D topography plot of the mixed ceramic (CC650) (b) 3D topography of the reinforced ceramic (CC670). |
3.2 Specific cutting force
The second part of the comparison consists of a study of the specific cutting force in terms of machining parameters (cutting speed, feed rate and depth of cut) during production control. The value of specific cutting force Ks was calculated by the following equation: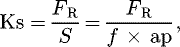 (1)where F
R is the resulting cutting force and S is the chip section.
(1)where F
R is the resulting cutting force and S is the chip section.
Figure 4a presents the effect of cutting speed on specific cutting force (Ks) at constant feed rate of 0.08 mm/rev and depth of cut of 0.25 mm. As it can be seen from this figure, the increase in cutting speed resulted in decrease of specific cutting force for both cutting tools; CC650 and CC670. This trend is mainly due to increase in temperature at shear plane region, resulting in the plastic softening of this primary deformation zone and hence reduced shear strength of the material. In turn this will reduce the force required to deform the material to be machined [19].
Figure 4b presents the effect of feed rate on specific cutting force (Ks) at constant cutting speed Vc = 120 m/min and depth of cut ap = 0.25 mm for both ceramic tools CC650 and CC670. As it can be seen from this figure, the specific cutting force (Ks) tends to decrease, considerably with increase in feed rate (f). This figure also displays that the specific cutting force (Ks) is characterized by two distinct zones according to the feed rate evolution for CC650 and CC670 tools.
The first zone where the feed rate varies from 0.12 to 0.16 mm/rev corresponds to a decrease in specific cutting force for both ceramic tools. It is noticed that with the increase in feed rate, the specific cutting force decreases. For weak feed rates, we record extremely high specific cutting force. With the feed rate of 0.08 mm/rev, the specific cutting forces KsCC650 and KsCC650 are about 8442.1 and 9666.67 MPa. For the feed rate of 0.16 mm/rev, the specific cutting forces decrease successively on 16.5 and 21.4% for both ceramic tools CC650 and CC670, respectively.
The second zone is characterized by an interval where the specific cutting force is stabilized according to the drop in the cutting forces that expresses a relative of machining system [17]. In general, the insert CC650 provides lower values than the CC670 ceramic tool, which expresses the mixed ceramic (CC650) into the most powerful tool in terms of wear resistance and lifespan (Fig. 5). Similar results were reported by Fnides et al. [19] during hard turning of AISI H11 steel with mixed ceramic tool.
Figure 4c illustrates the evolution of the specific cutting force (Ks) according to the depth of cut at constant cutting speed Vc = 120 m/min and feed rate f = 0.08 mm/rev for both ceramic tools CC650 and CC670. It is noticed that the increase in cutting depth leads to a fall of the specific cutting force and for two different periods of evolution. The first decreasing zone corresponds to an enormous loading of the cutting edge. The recorded pressures are very high in this zone, for example for a depth of 0.1 mm, we record pressures KsCC650 and KsCC670 to be about 20679.10 and 26431.81 MPa. With the increase in cutting depth to 0.6 mm, the specific cutting forces fall successively from 32 and 10% for both. In general, the insert CC650 provides lower values than the CC670 ceramic tool.
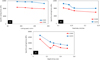 |
Fig. 4 Specific cutting force (Ks) evolution as a function of cutting conditions. (a) Cutting speed effect on Ks at f = 0.08 mm/rev; ap = 0.25 mm. (b) Feed rate effect on Ks at Vc = 120 m/min; ap = 0.25 mm. (c) Depth of cut effect on Ks at Vc = 120 m/min; f = 0.08 mm/rev. |
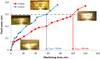 |
Fig. 5 VB of cutting materials versus machining time at ap = 0.15 mm; f = 0.08 mm/rev and Vc = 120 m/min. |
3.3 Flank wear
The tests of long duration of straight turning on AISI 4140 steel treated at 52 HRC were carried out. The purpose of these operations was to determine the wear curves as a function of machining time and therefore the tool life for both cutting materials used (CC650 and CC670). Figure 5 shows the evolution of the flank wear VB versus machining time at f = 0.08 mm/rev, ap = 0.15 mm and Vc = 120 m/min. The horizontal line in Figure 3 illustrates the allowable flank wear identified as [VB]. This figure indicates that the tool wear for both cutting tools increases with machining time; this is due to wear evolution on the rake and clearance surfaces of the tool. As a consequence, the workpiece–tool contact surface increases together with the friction forces, generating higher cutting forces [15]. According to the curve of mixed ceramic (CC650) and for a machining time of 180 s, the flank wear VB of this insert reaches a value of 0.05 mm. At the end of machining 120 min, the flank wear is 0.37 mm. This change represents an increase of 640%. The tool life of this insert is 105 min. The first machining test done with the reinforced ceramic CC670 generates a flank wear of 0.07 mm. For a machining time of 75 min, its wear VB is 0.38 mm, which defines the lifespan of this tool as 58 min. These results prove that the mixed ceramic CC650 is more efficient than reinforced ceramic CC670 in terms of wear resistance.
As with the similarity of flank wear progress, the same phenomenon has been observed in testing the effect of the machining time on cutting forces. Figure 6 represents the evolution of cutting forces (Fa, Ft and Fr) with increase of machining time for both the ceramic tools (CC670 and CC650). It indicates that the cutting forces increase with the increase in machining time, and hence as a function of flank wear (i.e. generally, the evolution of wear is confined to three distinct regions, namely, initial breakdown, uniform wear rate and rapid breakdown of the cutting edge). This is due to wear evolution on the rake and clearance surfaces of the tool. As a consequence, the workpiece–tool contact surface increases together with the friction forces, generating higher resulting force. These results are similar to those mentioned by Gaitonde [1].
The micrographs of flank wear of CC650 insert at the cutting regime Vc = 120 m/min, ap = 0.15 mm and f = 0.08 mm/rev are presented in Figure 7. For the considered regime, flank wear VB of the mixed ceramic CC650 spreads regularly. Figure 8 shows the micrographs of flank wear of CC670 insert at the cutting regime Vc =120 m/min, ap = 0.15 mm and f = 0.08 mm/rev. For these values, flank wear VB of the mixed ceramic CC670 spreads irregularly.
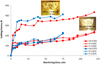 |
Fig. 6 Cutting forces versus machining time at ap = 0.15 mm; f = 0.08 mm/rev and Vc = 120 m/min. |
 |
Fig. 7 Micrographs for VB of CC650 at ap = 0.15 mm; f = 0.08 mm/rev and Vc = 120 m/min. |
 |
Fig. 8 Micrographs for VB of CC670 at ap = 0.15 mm; f = 0.08 mm/rev and Vc = 120 m/min. |
4 Response surface methodology
RSM is a type of modeling to find out the relation between various factors with the response. It is useful for developing, improving and optimizing the process which provides an understanding of the process within the area of interest. For using RSM, a proper design of experiments is essentially required where parameter along with its range selection is important. In the present investigation, cutting speed, feed rate and cutting time are identified as process parameters. In RSM design, there should be at least two levels for each factor. In this way, the factor values that are not actually tested using fewer experimental combinations and the combinations themselves can be estimated [20,21].
Table 2 presents experimental results of surface roughness, specific cutting force and flank wear for various combinations of cutting regime parameters (cutting speed, feed rate and cutting time) according to 23 (8) full factorial design for both ceramic tools.
The results of ANOVA for surface roughness, specific cutting force and flank wear are shown in Tables 3–5. These tables also show the degrees of freedom (DF), sum of squares (SS), mean square (MS), F-values (F-value) and probability (Prob.) of each factor and different interactions. A low P-value (Prob.) indicates statistical significance for the source on the corresponding response.
Table 3 shows the results of ANOVA for surface roughness of CC650 and CC670 tools. This analysis was carried out for a 5% significance level, i.e. for a 95% confidence level. The last column of the table shows the percentage of each factor contribution (Cont.%) on the total variation, thus indicating the degree of influence on the result. From Table 3, it can be seen that the feed rate factor (82.17 and 29.36%) and the interaction feed rate/cutting time (9.36 and 55.39%) have the major statistical significance as regard surface roughness of CC650 and CC670, respectively. The cutting speed and cutting time do not present a statistically significant effect on Ra.
The other important coefficient R 2 in the resulting ANOVA table is defined as the ratio of the explained variation to the total variation and is a measure of the degree of fit. When R 2 approaches to unity, the better response model fits the actual data. The values of R 2 calculated in Table 3 for these models are over 0.90 and reasonably close to unity, which are acceptable. It denotes that about 95% of the variability in the data is explained by these models. It also confirms that these models provide an excellent explanation of the relationship between the independent factors and the response.
Table 4 presents ANOVA results for Ks. It can be seen that the cutting time is the most important factor affecting specific cutting force. Its contribution is 82.42 and 91.167%, respectively; (CC650 and CC670) for these models. The cutting speed and feed rate factors show little statistical significance with respect to Ks. Similarly, the interactions (Vc× f), (Vc× t) and (f × t) are not significant.
The R 2 value is high, close to 1, which is desirable. The “R-Squared” of (0.9268 and 0.9431) are in reasonable agreement with the “Adj R-Squared” of (0.4877 and 0.6020) for CC650 and CC670 tools, respectively. The adjusted R 2 value is particularly useful when comparing models with different number of terms. “Adequate Precision” measures the signal-to-noise ratio. A ratio greater than 4 is desirable. Our ratio of (3.599 and 4.508) for CC650 and CC670 tools, respectively, indicates an adequate signal. So, these models can be used to navigate the design space.
Finally, from the Table 5, it can be apparently seen that the cutting time is the most important factor affecting VB. Its contribution is 48.784 and 80.276% for CC650 and CC670 tools, respectively. The next largest factor influencing on VB is cutting speed, with 32.466 and 14.199% contribution. The feed rate with 12.196 and 3.709% contribution has a very weak significance effect.
The R 2 value is high, close to 1, which is desirable. The “R-Squared” of (0.9987 and 0.9999) are in reasonable agreement with the “Adj R-Squared” of (0.9906 and 0.9995) for CC650 and CC670 tools, respectively. The adjusted R 2 value is particularly useful when comparing models with different number of terms. “Adequate Precision” measures the signal to noise ratio. A ratio greater than 4 is desirable. Our ratio of (33.261 and 123.288) for CC650 and CC670 tools, respectively, indicates an adequate signal. So, these models can be used to navigate the design space.
Analysis of variance for Ra.
Analysis of variance for Ks.
Analysis of variance for VB.
5 Regression equations
The relationship between the factors and the performance measures were modeled by multiple linear regressions. The regression equations obtained were as follows:
Regression equation for surface roughness (RaCC650) obtained from the experimental data is given by equation (2). Its coefficient of determination (R
2) is 92.68%. (2)
(2)
The surface roughness (RaCC670) model is given by the following equation (3) with a determination coefficient (R
2) of 94.88%.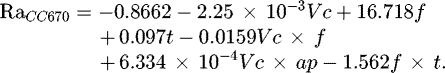 (3)
(3)
Regression equation for specific cutting force (Ks
CC650) obtained from the experimental data is given by equation (4). Its coefficient of determination (R
2) is 99.20%.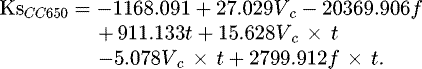 (4)
(4)
The specific cutting force (KsCC670) model is given by equation (5) with a determination coefficient (R
2) of 94.31%.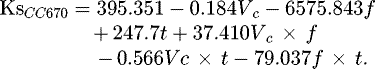 (5)
(5)
Regression equation for flank wear (VBCC650) obtained from the experimental data is given by equation (6). Its coefficient of determination (R
2) is 99.87%.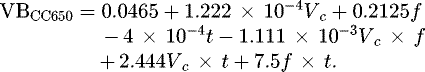 (6)
(6)
The flank wear (VBCC670) is given by equation (7) with a determination coefficient (R
2) of 99.99%.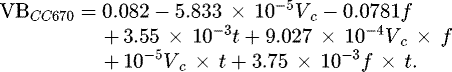 (7)
(7)
The above models are established for predicting the surface roughness, specific cutting force, flank wear, cutting speed, feed rate and cutting time. The depth of cut is limited in this study. The comparisons of measured-predicted values from the mathematical models are depicted in Figure 9. Comparison results prove that predicted values for each response are close to experimentally measured values (Table 6). The absolute mean errors for surface roughness and flank wear are found to be 1.38 and 0.05% and 4.875 and 0.0125% for mixed and reinforced ceramic tools, respectively. Results from the mathematical models indicate that they can be successfully applicable for predicting the surface roughness, specific cutting force and flank wear.
Figure 9 shows the comparison between the values of the surface roughness, specific cutting force and flank wear for both ceramic tools CC650 and CC670. The insert CC650 provides lower values than the CC670 ceramic tool. For example, RaCC670 ≈ 1.44RaCC650, KsCC670 ≈ 1.24KsCC650 and VBCC670 ≈ 1.21VBCC650.
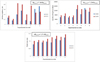 |
Fig. 9 Comparison between CC650 and CC670 for response factors. |
Comparison of results obtained from experiment with model.
6 Optimization of cutting conditions
Desirability function approach has been used for multiple response factors (Ra, Ks and VB) optimization. The optimization module searches for a combination of factor levels that simultaneously satisfy the requirements placed on each of the responses and factors in an attempt to establish the appropriate model. During the optimization process, the aim was to find the optimal values of machining parameters in order to produce the lowest surface roughness with minimal specific cutting force and flank wear. To resolve this type of parameter design problem, an objective function, F(x), is defined as follows [22]: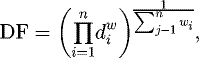 (8)
(8)
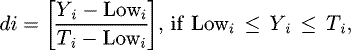
 where di
is the desirability defined for the ith targeted output and wi
is the weighting of di
. For various goals of each targeted output, the desirability, di
, is defined in different forms. If a goal is to reach a specific value of Ti
, the desirability di
is as follows:
where di
is the desirability defined for the ith targeted output and wi
is the weighting of di
. For various goals of each targeted output, the desirability, di
, is defined in different forms. If a goal is to reach a specific value of Ti
, the desirability di
is as follows:
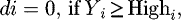
di = 0, if Y
i
≤ Low
i
, (9)
(9)
 (10)
(10)
 (11)For a goal to find a maximum, the desirability is shown as follows:
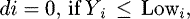 (12)
(12)
 (13)
(13)
 (14)
(14)
For a goal to search for a minimum, the desirability can be defined by the following formulas: (15)
(15)
 (16)
(16)
 (17)
(17)
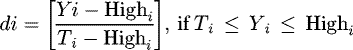
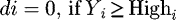
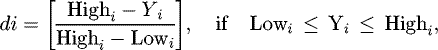
where Yi is the found value of the ith output during optimization processes; Low i and High i are, respectively, the minimum and the maximum values of the experimental data for the ith output. In equation (8), wi is set to 1 since di is equally important in this study. DF is a combined desirability function, and the objective is to choose an optimal setting that maximizes a combined desirability function DF, i.e. minimizes F(x).
The optimal manufacturing conditions for hard turning of AISI 4140 with the constraints of cutting parametric range is that corresponding to improve surface roughness and to lower values of specific cutting force and flank wear during the dry turning process. The constraints used during the optimization process are summarized in Table 7, whereas the optimal solutions are reported in Table 8 in a decreasing desirability level order. This same table shows the RSM optimization results for surface roughness, specific cutting force and flank wear. The optimum cutting parameters were obtained in Table 8 with cutting speed of 90–104.84 and 90–99.31 m/min, feed rate of 0.08–0.09 and 0.08 mm/rev and cutting time 5–5.28 and 5 mm for CC650 and CC670 tools, respectively.
Constraints for optimization of cutting conditions.
Optimization results.
7 Conclusions
The research work presents the application of RSM models, which influence the machining variables of surface roughness, specific cutting force and flank wear. The relationship between the factors and the performance measures were modeled by multiple linear regression. Three process parameters (cutting speed, feed rate and cutting time) are considered for the development of the models. The developed RSM models are tested through ANOVA and found to be adequate at 95% confidence interval. The following conclusions are drawn from the present investigation:
-
According to presented results, it can also be observed that the surface roughness (Ra) for both cutting inserts greatly improves with the increase in cutting speed, while showing the negative effects on feed rate, but the depth of cut a negligible influence.
-
The 3D visualization map of the machined surface is an important investigation tool. It confirmed some characteristic features of surfaces produced with both inserts tested, i.e. peaks and valleys.
-
During machinability study in dry hard turning, it is observed that the surface roughness is strongly influenced by the feed rate. Its contribution is 82.17 and 29.36%, for CC650 and CC670 tools, respectively. Also, the specific cutting pressures of CC650 and CC670 tools are strongly influenced by the cutting time 82.42 and 91.17%. In addition, the flank wear of CC650 and CC670 tools is also influenced by cutting time 12.19 and 3.70%, and in the second level by the cutting speed 32.46 and 14.20%, respectively. In general, this study confirms that in dry straight turning of this steel (AISI 4140) and for the cutting conditions tested, the mixed ceramic is better than reinforced ceramic in terms of surface roughness, specific cutting force and flank wear. The mean value ratios for RaCC670/RaCC650, KsCC670/KsCC650 and VBCC670/VBCC650 are 1.44, 1.24 and 1.21, respectively.
-
After the conduction of the experiments, it was found that the mixed ceramic insert (CC650) has better performance compared with reinforced ceramic insert (CC670) with reference in terms of surface roughness, specific cutting force and flank wear.
-
Using the point prediction method of optimization, the optimal setting of machining parameters of CC650 and CC670 tools are found to be cutting speeds of 90–104.84 and 90–99.31 m/min, feed rate of 0.08–0.09 and 0.08 mm/rev and cutting time 5–5.28 and 5 min, respectively. The desirability of this optimized condition also comes around 88.64 and 91.12%, respectively.
Nomenclature
ap: Depth of cut, mm
f : Feed rate, mm/rev
Fa: Feed force, N
Fr: Radial force, N
Ft: Tangential force, N
H : Workpiece hardness
HRC: Rockwell hardness
Ks: Specific cutting force, MPa
Ra: Surface roughness, μm
t : Cutting time, min
VB: Flank wear, mm
Vc : Cutting speed, m/min
α : Clearance angle, degree
γ : Rake angle, degree
λ : Inclination angle, degree
χ : Major cutting edge angle, degree
References
- V.N. Gaitonde, S.R. Karnik, M. Faustino, J.P. Davim, Machinability analysis in turning tungsten-copper composite for application in EDM electrodes, Int. J. Refract. Metals Hard Mater. 27 (2009) 754–763 [CrossRef] [Google Scholar]
- N. Mandal, B. Doloi, B. Mondal, Force prediction model of zirconia toughened alumina (ZTA) inserts in hard turning of AISI 4340 steel using response surface methodology, Int. J. Precis. Eng. Manuf. 13 (2012) 1589–1599 [CrossRef] [Google Scholar]
- K. Palanikumar, Application of Taguchi and response surface methodologies for surface roughness in machining glass fiber reinforced plastics by PCD tooling, Int. J. Adv. Manuf. Technol. 36 (2008) 19–27 [CrossRef] [Google Scholar]
- A.K. Sahoo, B. Sahoo, Mathematical modeling and multi-response optimization using response surface methodology and grey based Taguchi method: an experimental investigation, Int. J. Exp. Des. Process. Optimis. 2 (2011) 221–242 [CrossRef] [Google Scholar]
- S. Benlahmidi, H. Aouici, F. Boutaghane, A. Khellaf, B. Fnides, M.A. Yallese, Design optimization of cutting parameters when turning hardened AISI H11 steel (50 HRC) with CBN7020 tools, Int. J. Adv. Manuf. Technol. 89 (2017) 803–820 [CrossRef] [Google Scholar]
- H. Jenn-Tsong, L. Nun-Ming, C. Ko-Ta, Investigating the machinability evaluation of Hadfield steel in the hard turning with Al2O3/TiC mixed ceramic tool based on the response surface methodology, J. Mater. Process. Technol. 208 (2008) 532–541 [CrossRef] [Google Scholar]
- G.C. Benga, A.M. Abrão, Turning of hardened 100Cr6 bearing steel with ceramic and PCBN cutting tools, J. Mater. Process. Technol. 143 (2003) 237–241 [CrossRef] [Google Scholar]
- J.S. Dureja, V.K. Gupta, M. Dogra, Design optimization of cutting conditions and analysis of their effect on tool wear and surface roughness during hard turning of AISI-H11 steel with a coatedmixed ceramic tool, J. Eng. Manuf. 223 (2009) 1441–1453 [CrossRef] [Google Scholar]
- S. Neseli, S. Yaldiz, E. Türkes, Optimization of tool geometry parameters for turning operations based on the response surface methodology, Measurement 44 (2011) 580–587 [CrossRef] [Google Scholar]
- M. Elbah, M.A. Yallese, H. Aouici, T. Mabrouki, J.F. Rigal, Comparative assessment of wiper and conventional ceramic tools on surface roughness in hard turning AISI 4140 steel, Measurement. 46 (2013) 3041–3056 [CrossRef] [Google Scholar]
- DI. Lalwani, N.K. Mehta, P.K. Jain, Experimental investigations of cutting parameters influence on cutting forces and surface roughness in finish hard turning of MDN250 steel, J. Mater. Process. Technol. 206 (2008) 167–179 [CrossRef] [Google Scholar]
- H. Aouici, M. Elbah, M.A. Yallese, B. Fnides, I. Meddour, S. Benlahmidi, Performance comparison of wiper and conventional ceramic inserts in hard turning of AISI 4140 steel: analysis of machining forces and flank wear, Int. J. Adv. Manuf. Technol. 87 (2016) 2221–2244 [CrossRef] [Google Scholar]
- H. Aouici, M.A. Yallese, K. Chaoui, T. Mabrouki, JF. Rigal, Analysis of surface roughness and cutting force components in hard turning with CBN tool: prediction model and cutting conditions optimization, Measurement. 45 (2012) 344–353 [CrossRef] [Google Scholar]
- H. Aouici, M.A. Yallese, B. Fnides, K. Chaoui, T. Mabrouki, Modeling and optimization of hard turning of X38CrMoV5-1 steel with CBN tool: machining parameters effects on flank wear and surface roughness, J. Mech. Sci. Technol. 25 (2011) 2843–2851 [CrossRef] [Google Scholar]
- H. Bouchelaghem, M.A. Yallese, T. Mabrouki, A. Amirat, J.F. Rigal, Experimental investigation and performance analyses of CBN insert in hard turning of cold work tool steel (D3), Mach. Sci. Technol. 14 (2010) 471–501 [CrossRef] [Google Scholar]
- B. Fnides, H. Aouici, M.A. Yallese, Cutting forces and surface roughness in hard turning of hot work steel X38CrMoV5-1 using mixed ceramic, Mechanika 2 (2008) 73–78 [Google Scholar]
- H. Aouici, H. Bouchelaghem, M.A. Yallese, M. Elbah, B. Fnides, Machinability investigation in hard turning of AISI D3 cold work steel with ceramic tool using response surface methodology, Int. J. Adv. Manuf. Technol. 73 (2014) 1775–1788 [CrossRef] [Google Scholar]
- A. Khellaf, H. Aouici, S. Smaiah, S. Boutabba, M.A. Yallese, M. Elbah, Comparative assessment of two ceramic cutting tools on surface roughness in hard turning of AISI H11 steel: including 2D and 3D surface topography, Int. J. Adv. Manuf. Technol. 89 (2017) 333–354 [CrossRef] [Google Scholar]
- B. Fnides, M.A. Yallese, H. Aouici, Hard turning of hot work steel AISI H11: evaluation of cutting pressures, resulting force and temperature, Mechanika 4 (2008) 1392–1207 [Google Scholar]
- Z. Hessainia, M.A. Yallese, K. Chaoui, T. Mabrouki, J.F. Rigal, On the prediction of surface roughness in the hard turning based on cutting parameters and tool vibrations, Measurement. 46 (2013) 1671–1681 [CrossRef] [Google Scholar]
- M.W. Azizi, A. Belbah, M.A. Yallese, T. Mabrouki, JF. Rigal, Surface roughness and cutting forces modeling for optimization of machining condition in finish hard turning of AISI 52100 steel, J. Mech. Sci. Technol. 25 (2012) 4105–4114 [CrossRef] [Google Scholar]
- M.F. Ameur, M. Habak, M. Kenane, H. Aouici, M. Cheikh, Machinability analysis of dry drilling of carbon/epoxy composites: cases of exit delamination and cylindricity error, Int. J. Adv. Manuf. Technol. 88 (2017) 2557–2571 [CrossRef] [Google Scholar]
Cite this article as: H. Aouici, M. Elbah, A. Benkhelladi, B. Fnides, L. Boulanouar, M.A. Yallese, Comparison on various machinability aspects between mixed and reinforced ceramics when machining hardened steels, Mechanics & Industry 20, 109 (2019)
All Tables
All Figures
|
Fig. 1 Illustration of cutting tool geometry and experimental configuration for measuring surface roughness criteria [14]. |
| In the text | |
|
Fig. 2 Surface roughness (Ra) evolution as a function of cutting conditions. (a) Cutting speed effect on Ra at f = 0.08 mm/rev; ap = 0.25 mm. (b) Feed rate effect on Ra at Vc = 120 m/min; ap = 0.25 mm. (c) Depth of cut effect on Ra at Vc = 120 m/min; f = 0.08 mm/rev. |
| In the text | |
|
Fig. 3 (a) 3D topography plot of the mixed ceramic (CC650) (b) 3D topography of the reinforced ceramic (CC670). |
| In the text | |
|
Fig. 4 Specific cutting force (Ks) evolution as a function of cutting conditions. (a) Cutting speed effect on Ks at f = 0.08 mm/rev; ap = 0.25 mm. (b) Feed rate effect on Ks at Vc = 120 m/min; ap = 0.25 mm. (c) Depth of cut effect on Ks at Vc = 120 m/min; f = 0.08 mm/rev. |
| In the text | |
|
Fig. 5 VB of cutting materials versus machining time at ap = 0.15 mm; f = 0.08 mm/rev and Vc = 120 m/min. |
| In the text | |
|
Fig. 6 Cutting forces versus machining time at ap = 0.15 mm; f = 0.08 mm/rev and Vc = 120 m/min. |
| In the text | |
|
Fig. 7 Micrographs for VB of CC650 at ap = 0.15 mm; f = 0.08 mm/rev and Vc = 120 m/min. |
| In the text | |
|
Fig. 8 Micrographs for VB of CC670 at ap = 0.15 mm; f = 0.08 mm/rev and Vc = 120 m/min. |
| In the text | |
|
Fig. 9 Comparison between CC650 and CC670 for response factors. |
| In the text | |
Current usage metrics show cumulative count of Article Views (full-text article views including HTML views, PDF and ePub downloads, according to the available data) and Abstracts Views on Vision4Press platform.
Data correspond to usage on the plateform after 2015. The current usage metrics is available 48-96 hours after online publication and is updated daily on week days.
Initial download of the metrics may take a while.