Fig. 16
Download original image
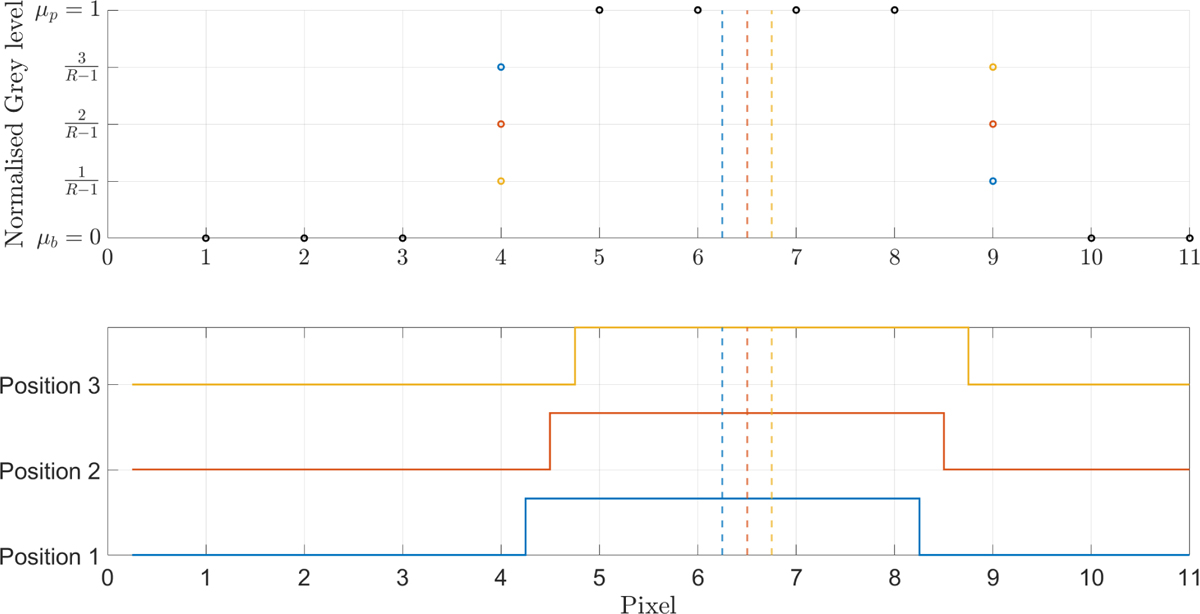
Relation between the greyscale level and the position of the barycenter. The upper graph illustrates the normalized grey levels across various pixels after image preprocessing steps, where μp = 1 and μb = 0, for a quantification level of R = 5. The lower graph displays the respective beam positions. The dashed lines indicate the estimated centre of each beam using the barycenter method.
Current usage metrics show cumulative count of Article Views (full-text article views including HTML views, PDF and ePub downloads, according to the available data) and Abstracts Views on Vision4Press platform.
Data correspond to usage on the plateform after 2015. The current usage metrics is available 48-96 hours after online publication and is updated daily on week days.
Initial download of the metrics may take a while.