Fig. 19
Download original image
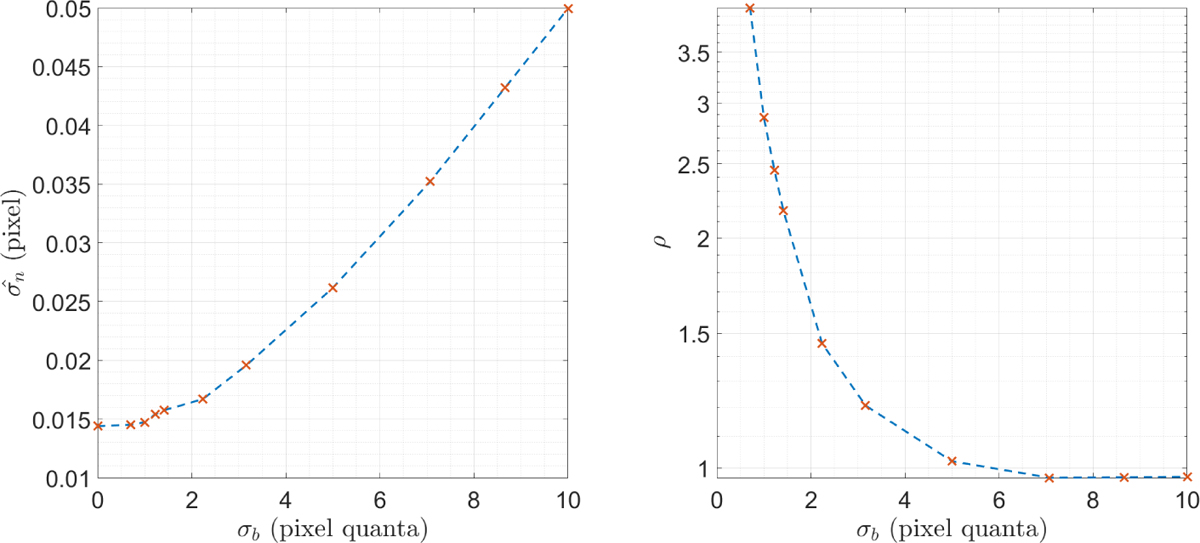
Validation of the relationship between the standard deviation of the noise added to the images and that which disturbs the position of the beam’s barycenter. Left plot: estimated value of the standard deviation of the noise in the barycenter position. Right plot: ![]() as a function of the noise standard deviation σb.
as a function of the noise standard deviation σb.
Current usage metrics show cumulative count of Article Views (full-text article views including HTML views, PDF and ePub downloads, according to the available data) and Abstracts Views on Vision4Press platform.
Data correspond to usage on the plateform after 2015. The current usage metrics is available 48-96 hours after online publication and is updated daily on week days.
Initial download of the metrics may take a while.