Fig. 23
Download original image
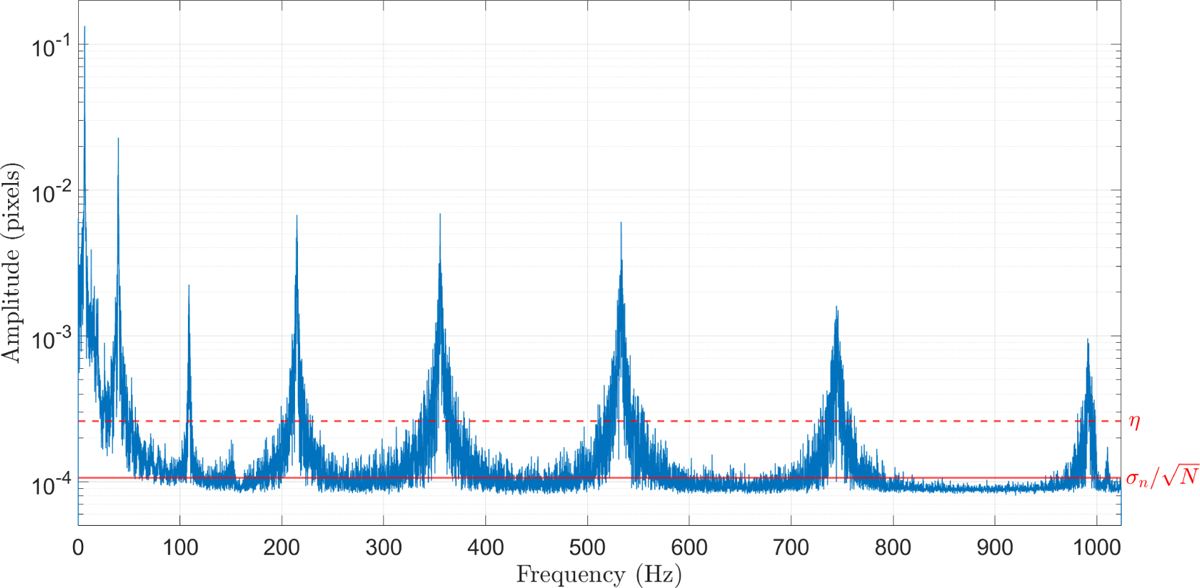
Barycenter position amplitude spectrum example where R = 256 grey levels, α = 0.05, σb = 3.6 pixel quanta, μp = 255 pixel quanta and μb = 18.1 pixel quanta. The solid red line corresponds to the value of ![]() where σn is estimated with equation (33) and the dashed red line corresponds to the associated value of η with a 95% confidence level.
where σn is estimated with equation (33) and the dashed red line corresponds to the associated value of η with a 95% confidence level.
Current usage metrics show cumulative count of Article Views (full-text article views including HTML views, PDF and ePub downloads, according to the available data) and Abstracts Views on Vision4Press platform.
Data correspond to usage on the plateform after 2015. The current usage metrics is available 48-96 hours after online publication and is updated daily on week days.
Initial download of the metrics may take a while.